Table of Contents
Developed in Japan centuries ago, Heikin-Ashi candlesticks offer traders a fresh perspective on price movements, smoothing out market noise and providing valuable insights. In this article, we will dig deeper into the world of Heikin-Ashi candlesticks, exploring their historical context, construction methods, and how traders can employ them effectively in their quest for profitable trading strategies.
Origins of Heikin-Ashi
To appreciate the significance of Heikin-Ashi candlesticks, it’s essential to understand their historical roots. The name “Heikin-Ashi” translates to “average bar” in Japanese, reflecting its original purpose as a tool for Japanese rice traders. It was developed by Munehisa Homma, a legendary 18th-century rice trader who is often considered the father of candlestick charting.
Homma’s pioneering work laid the foundation for candlestick analysis, and Heikin-Ashi charts were an integral part of his approach. However, it wasn’t until the late 20th century that Heikin-Ashi charts gained renewed popularity in the Western trading world as traders sought alternative methods to analyze price data more effectively.
What is Heikin Ashi?
Heikin Ashi is a Japanese term that translates to “average bar” or “average pace.” It is a unique type of candlestick charting technique used by traders and technical analysts to gain insights into market trends and reduce the noise present in traditional candlestick charts. Developed in Japan and popularized in the West in recent decades, Heikin Ashi charts aim to provide a more intuitive and smoother representation of price movements.
The key characteristics of Heikin Ashi charts include:
- Smoothing Effect: Heikin Ashi charts filter out market noise, which is often caused by short-term price fluctuations or volatility. This filtering process results in smoother, more visually appealing candlestick patterns.
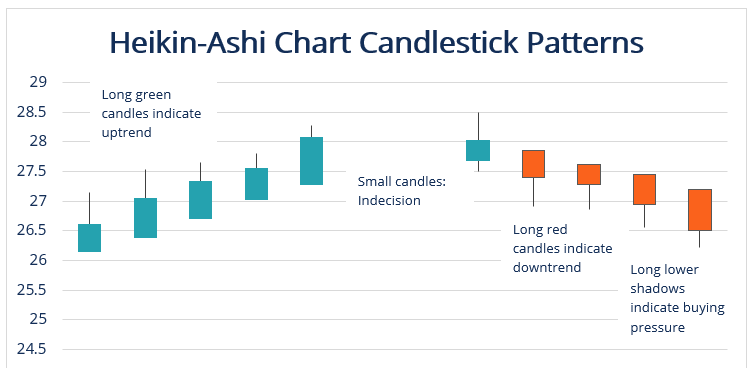
- Trend Clarity: These charts excel in highlighting and clarifying market trends, making it easier for traders to identify whether the market is in an uptrend, downtrend, or ranging. This is particularly valuable for trend-following strategies.
- Reversal Signals: Heikin Ashi charts are effective at revealing potential trend reversals. Certain candlestick patterns on Heikin Ashi charts can signal indecision in the market, offering traders early warnings of possible trend changes.
- Support and Resistance: Heikin-Ashi candlestick patterns also aid in identifying critical support and resistance levels more effectively. These levels are often mirrored in the chart through specific reactions of price to different types of Heikin-Ashi candles, providing traders with valuable insights for decision-making.
Construction of Heikin-Ashi Candlesticks
Unlike traditional candlestick charts, Heikin-Ashi candlesticks employ a modified formula that considers both the current and previous candlestick values. Let’s delve deeper into the step-by-step process of constructing Heikin-Ashi candlesticks:
- Calculate the Average Price: To begin, the Heikin-Ashi open is determined by averaging the previous candle’s open and close prices. Similarly, the Heikin-Ashi close is calculated as the average of the open, close, high, and low prices of the current candle.
- Determine the Heikin-Ashi High and Low: The Heikin-Ashi high is determined as the maximum value among the high, open, or close prices of the current candle. Conversely, the Heikin-Ashi low is the minimum value among the low, open, or close prices.
- Plotting the Heikin-Ashi Candle: With these calculated values, a Heikin-Ashi candle is formed, presenting a smoothed representation of price action that provides a distinct visual representation of market trends and reversals.
How to Calculate Heikin Ashi?
Calculating Heikin Ashi candlesticks involves a series of mathematical operations to derive the open, high, low, and close prices for each period. Here’s a summary of the calculations:
- Heikin Ashi Close (HA_Close): HA_Close is the average of the open, high, low, and close prices for the current period.
- Heikin Ashi Open (HA_Open): HA_Open is the average of the previous period’s Heikin Ashi open and close prices. For the first period, it is usually the average of the open and close prices of that period.
- Heikin Ashi High (HA_High): HA_High is the maximum value among the high, Heikin Ashi open, and Heikin Ashi close prices for the current period.
- Heikin Ashi Low (HA_Low): HA_Low is the minimum value among the low, Heikin Ashi open, and Heikin Ashi close prices for the current period.
These calculations are performed for each period in the price data series, resulting in a sequence of Heikin Ashi candlestick values. This smoothing effect helps traders identify trends and significant price levels more clearly.
Using Heikin-Ashi in Trading
Now that we’ve explored the construction and unique characteristics of Heikin-Ashi candlesticks, it’s important to understand how traders can integrate them effectively into their trading strategies:
- Trend Confirmation: Heikin-Ashi candlesticks are invaluable for confirming existing trends. Traders can enter or maintain positions when they observe a consistent series of Heikin-Ashi candles aligning with their chosen trend direction, enhancing their confidence in the sustainability of that trend.
- Reversal Signals: Heikin-Ashi charts are exceptional tools for spotting potential trend reversals. Traders should watch for specific Heikin-Ashi patterns that indicate indecision, as they may serve as early signals for trend reversals. These insights can be pivotal in making timely exits from positions or even considering counter-trend trades.
- Risk Management: As with any technical analysis tool, Heikin-Ashi candlesticks should be used in conjunction with other indicators, risk management strategies, and due diligence. Traders should never solely rely on one chart type for making trading decisions. Instead, they should incorporate Heikin-Ashi charts into a holistic approach to trading that encompasses various factors, including market fundamentals and external events.
How to Use a Heikin Ashi Chart?
Heikin Ashi charts can be employed for various purposes, including:
- Trend Identification: Traders often use Heikin Ashi charts to identify and confirm trends. A series of consistent Heikin Ashi candles in the same direction can provide confidence in the trend’s strength and longevity.
- Reversal Signals: Heikin Ashi charts are particularly adept at spotting potential trend reversals. Patterns like doji-like candles with small bodies and long wicks may indicate market indecision and signal a possible reversal.
- Support and Resistance: Heikin Ashi patterns can assist traders in identifying support and resistance levels more effectively. These levels are often mirrored in the chart through specific reactions of price to different types of Heikin Ashi candles.
- Entry and Exit Points: Traders may use Heikin Ashi charts to determine optimal entry and exit points for their trades based on the trend and reversal signals provided by these charts.
- Confirmation: Heikin Ashi charts can be used alongside other technical indicators and analysis techniques to confirm signals and improve the accuracy of trading decisions.
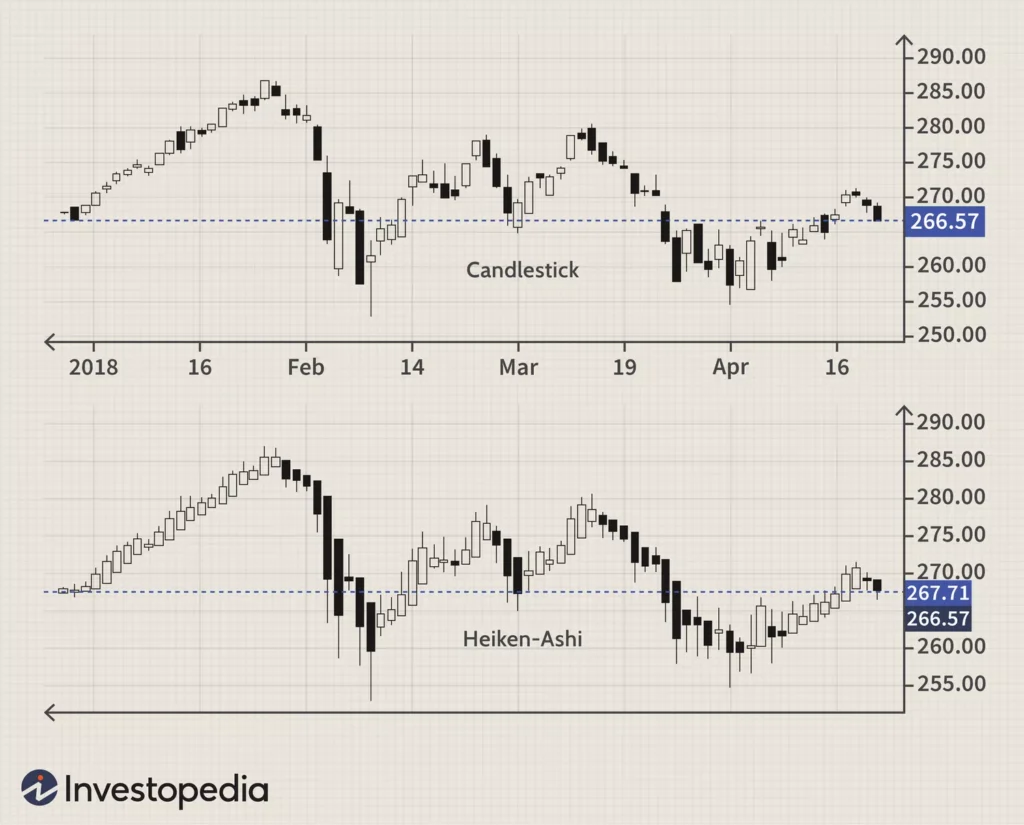
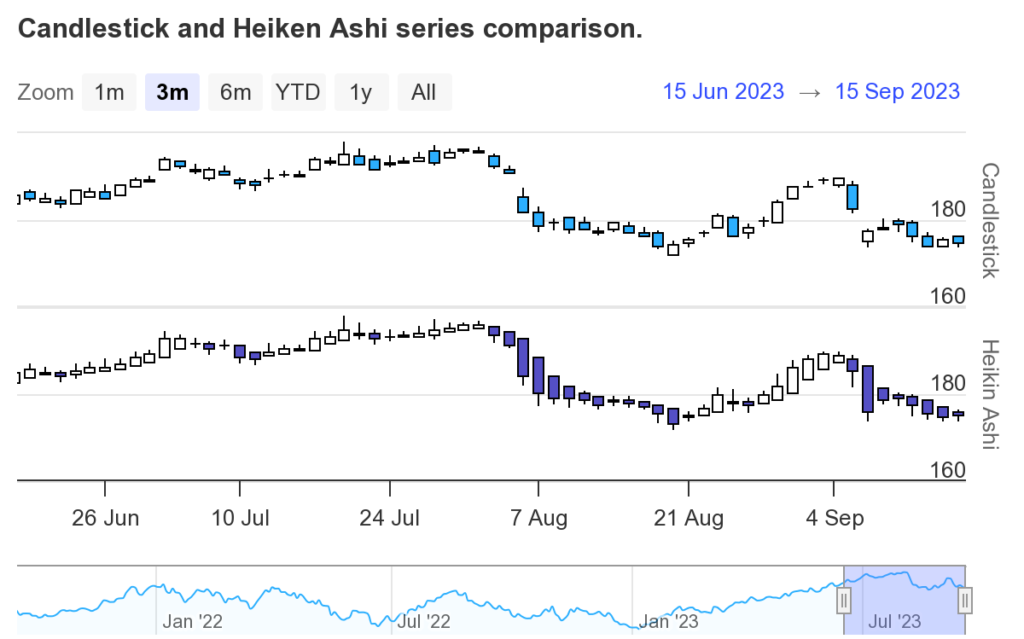
Heikin Ashi Candlestick Chart vs. Traditional Japanese Candlestick Chart
Heikin Ashi Candlestick Chart and Traditional Japanese Candlestick Chart represent price data differently:
- Traditional Japanese Candlestick Chart: In this widely used chart type, each candlestick represents a specific time period (e.g., one day or one hour). It consists of four primary prices: open, high, low, and close. The color and shape of the candlestick convey information about market sentiment and direction. A bullish (uptrend) candlestick is typically white or hollow, indicating that the closing price is higher than the opening price. A bearish (downtrend) candlestick is usually black or filled, signifying that the closing price is lower than the opening price.
- Heikin Ashi Candlestick Chart: Heikin Ashi charts use a modified formula to calculate open, high, low, and close prices for each candlestick. These values are based on the previous period’s Heikin Ashi prices. In Heikin Ashi charts, bullish trends are typically represented by green (or hollow) candlesticks, and bearish trends are depicted by red (or filled) candlesticks. These colors remain consistent for an extended period as long as the trend persists.
The key difference is that Heikin Ashi charts aim to provide a smoother representation of price action by considering past candlestick data, making them more suitable for identifying and confirming trends.
Limitations of Heikin Ashi
While Heikin Ashi charts offer many advantages, they also have limitations that traders should be aware of:
- Lagging Indicator: Heikin Ashi candlesticks are based on past prices, which means they may lag behind current market conditions. Traders should be cautious of delayed signals, especially in rapidly changing markets.
- False Signals: Like any technical indicator, Heikin Ashi charts are not immune to providing false signals. Traders should use additional confirmation techniques or indicators to reduce the risk of acting on misleading signals.
- Not Suitable for All Strategies: Heikin Ashi charts may not be suitable for all trading strategies, especially those requiring precise timing or short-term scalping. Traders should choose chart types that align with their specific trading objectives.
- Market Conditions: The effectiveness of Heikin Ashi charts can vary depending on market conditions. They may work better in trending markets than in choppy or sideways markets. Traders should consider the overall market context when using these charts.
Conclusion
In summary, Heikin-Ashi candlesticks offer traders a powerful means of analyzing price data, reducing noise, and making well-informed trading decisions. While they may not be a panacea for all trading challenges, incorporating Heikin-Ashi charts into your trading toolbox can provide a fresh perspective on market trends and price action. As with any trading tool, achieving proficiency with Heikin-Ashi requires practice, patience, and a comprehensive understanding of their use.
FAQs about Heikin Ashi
1. What is the significance of the “Heikin Ashi” name?
The term “Heikin Ashi” translates to “average bar” in Japanese. It reflects the core concept of this charting technique, which is to provide a smoother representation of price action by averaging certain price data.
2. How do I interpret the colors of Heikin Ashi candlesticks?
In Heikin Ashi charts, green (or hollow) candlesticks typically represent bullish (uptrend) periods, indicating that the closing price is higher than the opening price. Conversely, red (or filled) candlesticks represent bearish (downtrend) periods, suggesting that the closing price is lower than the opening price.
3. Can I use Heikin Ashi charts for day trading?
Yes, Heikin Ashi charts can be used for day trading. They can help day traders identify intraday trends and potential reversal points. However, like any trading tool, it’s crucial to combine Heikin Ashi with other indicators and strategies for effective day trading.
4. Are Heikin Ashi charts suitable for long-term investing?
Heikin Ashi charts can be useful for long-term investors as well. They provide a clear view of long-term trends and can help investors make informed decisions about when to enter or exit long-term positions.
5. How do I choose between traditional candlestick charts and Heikin Ashi charts?
The choice between traditional and Heikin Ashi charts depends on your trading or investing strategy and personal preferences. Traditional candlestick charts are more sensitive to short-term price movements, while Heikin Ashi charts offer a smoother, trend-focused perspective. Traders often use both types of charts in combination to gain a comprehensive view of the market.
6. Can Heikin Ashi charts help me identify support and resistance levels?
Yes, Heikin Ashi charts can be used to identify support and resistance levels. Key support and resistance levels are often reflected in how price reacts to specific types of Heikin Ashi candles. Traders can look for patterns or areas where price tends to stall or reverse.
7. Are Heikin Ashi charts more effective for certain markets or assets?
Heikin Ashi charts are versatile and can be applied to various markets and asset classes, including stocks, commodities, forex, and cryptocurrencies. Their effectiveness may vary depending on market conditions, so it’s essential to consider the specific characteristics of the asset you are trading.
8. Can I combine Heikin Ashi charts with other technical indicators?
Yes, combining Heikin Ashi charts with other technical indicators is a common practice. Traders often use moving averages, oscillators, and trendlines alongside Heikin Ashi charts to enhance their trading strategies and confirm signals.