
Table of Contents
Candlestick chart patterns are the language of the financial markets, offering traders and investors profound insights into price dynamics and market sentiment. In this comprehensive guide, we’ll delve into various candlestick patterns, categorizing them into three main groups: Bullish Reversal, Bearish Reversal, and Continuation Patterns.
Each pattern tells a unique story about the battle between bulls and bears in the market. Whether you’re a novice or a seasoned trader, understanding these 35 critical candlestick patterns is vital for making informed decisions in the stock market.
How to Read Candlestick Charts?
Before we dive into the intricate world of candlestick patterns, let’s lay the foundation by understanding how to read candlestick charts:
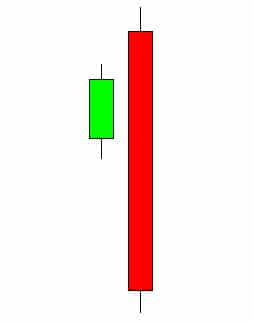
- Candlestick Components: Each candlestick consists of a body, representing the price range between the opening and closing prices within a specific timeframe. The wicks, or shadows, extend above and below the body, signifying the high and low prices during that period.
- Bullish vs. Bearish: Candlesticks come in two primary colors – bullish and bearish. A bullish (upward) candlestick forms when the closing price exceeds the opening price, typically appearing as white or green. Conversely, a bearish (downward) candlestick forms when the opening price exceeds the closing price, usually appearing as black or red.
- Patterns Emergence: Candlestick patterns emerge from the arrangement of multiple candlesticks over time, providing valuable insights into market sentiment and potential price movements.
35 Types of Candlestick Patterns List
Now, let’s embark on an exploration of the 35 essential candlestick chart patterns, categorized into Bullish Reversal, Bearish Reversal, and Continuation patterns.
Bullish Reversal Candlestick Patterns
1. Hammer
The hammer is a single candlestick pattern that typically appears at the end of a downtrend. It features a small real body near the high of the candle and a long lower shadow. This formation suggests that sellers pushed prices lower during the session, but buyers managed to push prices back up, closing near or above the opening price. The hammer indicates potential buying pressure and a shift from bearish to bullish sentiment.

2. Piercing Pattern
The piercing pattern is a two-candle bullish reversal signal. The first candle is bearish, reflecting a prevailing downtrend. The second candle is bullish and opens below the first candle’s low but closes above its midpoint. This pattern signifies that buyers have regained control, potentially leading to a bullish reversal.
3. Bullish Engulfing
The bullish engulfing pattern consists of two candles, with the second candle completely engulfing the first. This formation implies that buyers have overwhelmed sellers, signaling a reversal from bearish to bullish sentiment. It’s a powerful signal for traders looking to enter bullish positions.

4. The Morning Star
The morning star is a three-candle pattern. It starts with a bearish candle, followed by a small doji or spinning top, indicating market indecision. The third candle is bullish and closes well above the first candle’s open. This pattern suggests a potential bullish reversal from a bearish trend.
5. Three White Soldiers
The three white soldiers pattern is a strong bullish reversal signal. It comprises three consecutive long and bullish candles. Each candle opens higher and closes near its high, indicating consistent buying pressure and an emerging uptrend.

6. White Marubozu
A white marubozu is a single candlestick with a long body and no shadows. It represents strong bullish sentiment, as prices opened at the low and closed at the high of the session. This pattern indicates one-sided dominance by buyers.

7. Three Inside Up
The three inside up pattern involves three candles. The first is bearish, followed by a bullish candle fully contained within the range of the previous bearish candle. The third candle is another bullish candle that closes higher, signaling a potential reversal.
8. Bullish Harami
The bullish harami pattern consists of two candles. The first is a large bearish candle, followed by a small bullish candle fully contained within the range of the first candle. It suggests that the previous bearish momentum is waning, potentially leading to a bullish reversal.
9. Tweezer Bottom
A tweezer bottom pattern forms when two consecutive candles have identical or nearly identical lows. This indicates strong support at that price level, potentially leading to a bullish reversal.
10. Inverted Hammer
Similar to the hammer, the inverted hammer appears after a downtrend and signals a potential bullish reversal. It has a small body with a long upper shadow, suggesting that buyers are stepping in.

11. Three Outside Up
The three outside up pattern involves three candles. The first is bearish, followed by two consecutive bullish candles that completely engulf the first one, indicating a strong reversal from bearish to bullish sentiment.
12. On-Neck Pattern
The on-neck pattern appears after a bullish trend. It starts with a bearish candle, followed by a bullish candle that opens at or near the prior day’s close but closes near the low, potentially signaling a bearish reversal.
13. Bullish Counterattack
The bullish counterattack pattern is a strong bullish signal. It occurs when a large bullish candle engulfs the previous day’s bearish candle, indicating a decisive shift in sentiment in favor of the bulls.
Bearish Candlestick Patterns
14. Hanging Man
The hanging man pattern appears after an uptrend and signals a potential bearish reversal. It has a small body with a long lower shadow, suggesting that sellers are starting to gain control.

15. Dark Cloud Cover
The dark cloud cover pattern involves two candles. The first is bullish, followed by a bearish candle that opens above the previous day’s high but closes well below its midpoint. This pattern indicates a potential shift from bullish to bearish sentiment.
16. Bearish Engulfing Bar
The bearish engulfing pattern consists of two candles, with the second one fully engulfing the first. It suggests that sellers have overwhelmed buyers, potentially leading to a bearish reversal.
17. The Evening Star
Evening star is a three-candle pattern signals a potential reversal from bullish to bearish sentiment. The first candle is bullish, followed by a doji or a small candle indicating indecision. The third candle is bearish and closes well below the first candle’s open.
18. Three Black Crows
Three black crows is a strong bearish reversal pattern. It consists of three consecutive long and bearish candles, each opening higher and closing near its low, indicating consistent selling pressure.

19. Black Marubozu
A black marubozu is a single candlestick with a long body and no shadows. It represents strong bearish sentiment, as prices opened at the high and closed at the low of the session, indicating one-sided dominance by sellers.
20. Three Inside Down
The three inside down pattern involves three candles. The first is bullish, followed by a bearish candle that is entirely contained within the range of the previous bullish candle. The third candle is another bearish candle that closes lower, indicating a potential reversal.
21. Bearish Harami
The bearish harami pattern consists of two candles. The first one is a large bullish candle, and the second one is a small bearish candle fully contained within the range of the first candle. It suggests that the previous bullish momentum is weakening, and a bearish reversal might occur.
22. Shooting Star
Similar to the hanging man, the shooting star appears after an uptrend and signals a potential bearish reversal. It has a small body with a long upper shadow, indicating that sellers are starting to gain control.

23. Tweezer Top
A tweezer top pattern forms when two consecutive candles have identical or nearly identical highs. This indicates strong resistance at that price level, potentially leading to a bearish reversal.
24. Three Outside Down
The three outside down pattern involves three candles. The first is bullish, followed by two consecutive bearish candles that completely engulf the first one, indicating a strong reversal from bullish to bearish sentiment.
25. Bearish Counterattack
The bearish counterattack pattern is a strong bearish signal. It occurs when a large bearish candle engulfs the previous day’s bullish candle, indicating a decisive shift in sentiment in favor of the bears.
Continuation Candlestick Patterns
26. Doji
The doji pattern represents market indecision, with the opening and closing prices nearly identical. It can signal either a continuation or a reversal, depending on the context.

27. Spinning Top
A spinning top is a small-bodied candle with wicks on both ends, indicating uncertainty and indecision in the market. It suggests that a trend may be losing momentum or experiencing a temporary pause.

28. Falling Three Methods
This bearish continuation pattern consists of a series of small bearish candles within the range of a larger bullish candle. It suggests that the existing bullish trend may continue.
29. Rising Three Methods
The rising three methods pattern is a bullish continuation signal, featuring a series of small bullish candles within the range of a larger bearish candle. It indicates that the prevailing bearish trend may persist.
30. Upside Tasuki Gap
The upside tasuki gap is a bullish continuation pattern that occurs with a gap up between the second and third candles, signaling that the uptrend may resume.
31. Downside Tasuki Gap
The downside tasuki gap is a bearish continuation pattern with a gap down between the second and third candles, suggesting that the downtrend may continue.
32. Mat-Hold
The mat-hold pattern implies a brief pause before the existing trend resumes. It can provide an opportunity for traders to rejoin the prevailing trend.
33. Rising Window
Also known as a “gap up,” this bullish pattern indicates a continuation of the uptrend, with the second candle opening above the first candle’s high.
34. Falling Window
Also known as a “gap down,” this bearish pattern suggests a continuation of the downtrend, with the second candle opening below the first candle’s low.
35. High Wave
The high wave pattern is characterized by long upper and lower shadows and a small body. It reflects market indecision and uncertainty, signaling a potential pause in the current trend.
Candlestick Patterns Key Takeaways
Candlestick patterns are not standalone trading strategies but rather essential components of a trader’s toolkit. To maximize their effectiveness, consider the following key takeaways:
- Confirmation is Key: Always look for confirmation from other technical indicators or chart patterns before making a trading decision based solely on a candlestick pattern.
- Practice and Patience: Becoming proficient in recognizing and interpreting candlestick patterns takes practice and patience. Start with the most common patterns and gradually expand your knowledge.
- Risk Management: Implement risk management strategies such as stop-loss orders and proper position sizing to protect your capital.
- Stay Informed: Stay updated with market news and economic events, as these can influence the effectiveness of candlestick patterns.
- Continuous Learning: The world of trading is dynamic. Keep learning and adapting your strategies to changing market conditions.
Conclusion
Mastering candlestick chart patterns is a fundamental skill for anyone navigating the stock market. These patterns offer unparalleled insights into market dynamics and potential price movements. Whether you’re seeking bullish reversals, bearish indications, or continuation signals, understanding these 35 candlestick patterns empowers you to make well-informed decisions in your trading journey.
Remember to complement this knowledge with other forms of analysis and robust risk management to maximize your success in the stock market.
Candlestick Chart Pattern FAQs:
Now, let’s address some common questions that traders often have about candlestick patterns.
1. Are candlestick patterns always reliable for making trading decisions?
Candlestick patterns offer valuable insights, but they are not infallible. Their reliability depends on various factors, including the timeframe, market conditions, and the presence of confirming indicators.
2. Can candlestick patterns be used in all financial markets?
Yes, candlestick patterns can be applied to all financial markets, including stocks, forex, commodities, and cryptocurrencies. However, their effectiveness may vary across different markets due to varying levels of liquidity and volatility.
3. Should I use candlestick patterns for short-term or long-term trading?
Candlestick patterns can be effective for both short-term and long-term trading strategies. The choice of timeframe should align with your trading goals and risk tolerance.
4. How can I practice identifying and trading candlestick patterns?
Practice using demo trading accounts offered by many online brokers. Additionally, take advantage of educational resources, attend webinars, and read books on technical analysis to deepen your knowledge.
5. Are candlestick patterns more effective in trending or ranging markets?
Candlestick patterns can be applied in both trending and ranging markets. In trending markets, they help identify potential reversals or continuation signals. In ranging markets, they indicate indecision and potential breakout opportunities.
6. Do I need to memorize all candlestick patterns?
While it’s valuable to be familiar with a broad range of candlestick patterns, focus on mastering the most common and reliable ones first. Over time, you’ll become more adept at recognizing patterns naturally.