
Table of Contents
In the vast landscape of technical analysis, traders and investors constantly seek reliable indicators to navigate the complex world of financial markets. Among the many tools at their disposal, the Evening Star Pattern stands out as a significant player in the realm of candlestick charting.
This pattern serves as a powerful signal of potential trend reversals, and mastering its interpretation can be a valuable asset for traders in various markets, including the ever-volatile forex market.
In this comprehensive article, we will take an in-depth look at what the Evening Star Pattern represents, its implications, and provide a vivid example chart for a clearer understanding.
What is the Evening Star Pattern?
The Evening Star Pattern is a bearish reversal pattern that emerges at the culmination of an uptrend. Comprising three distinct candlesticks, it acts as a harbinger of a possible price reversal to the downside. To comprehend this pattern fully, let’s dissect its components:
- The First Candle (Bullish): The Evening Star Pattern commences with a robust bullish candle, typically signaling the continuation of a pre-existing uptrend. This candle represents the bullish fervor in the market, often driven by positive news, strong fundamentals, or a combination of factors.
- The Second Candle (Indecision): Following the bullish candle, the pattern presents a smaller candlestick characterized by a small body. This candle embodies market indecision, and its form can manifest as a doji, spinning top, or a small-bodied candle. It symbolizes a brief phase where buyers and sellers engage in a tug-of-war, unsure about the next market direction.
- The Third Candle (Bearish): The Evening Star Pattern culminates with a bearish candlestick that conclusively closes well below the opening of the first bullish candle. This bearish candle is a clear testament to the shift in market sentiment, transitioning from bullish optimism to bearish caution or even pessimism.
Analyzing the Implications of Evening Star Pattern
Deciphering the implications of the Evening Star Pattern is a pivotal skill for traders and investors looking to make sound decisions in the financial markets. Understanding what this pattern implies can provide a critical edge in timing trades and managing risk effectively. Here’s a more detailed breakdown of the implications:
- Shift in Momentum: The Evening Star Pattern serves as a potent signal that the previously dominant bullish momentum is showing signs of fatigue. It’s akin to a flashing caution sign for traders, indicating that the prevailing upward trend may be losing its grip. This shift in momentum hints at the potential transition from a thriving uptrend to a looming downtrend.
- Trading Opportunity: Traders often view the Evening Star Pattern as an opportune moment to take action. When this pattern emerges after an extended uptrend, it presents a compelling trading opportunity. It essentially says, “Proceed with caution; the market dynamics are evolving.” Traders, particularly those with a bearish bias, may consider initiating selling positions or short trades. These actions are taken in anticipation of a reversal in the market’s direction, with the goal of profiting from falling prices.
- The Role of the Second Candle: The second candle in the Evening Star Pattern is often the focal point of market indecision. This candle, characterized by a small body or sometimes a doji or spinning top, mirrors a period of uncertainty and hesitation within the market. It’s as if the market is momentarily caught in a tug-of-war, with neither the bulls nor bears able to assert dominance definitively. This candle acts as a poignant reminder that market sentiment is in flux, emphasizing the imminent change in direction.
- Confirmation by the Third Candle: The strength of the Evening Star Pattern’s bearish signal reaches its zenith with the third candle. This candle typically exhibits a substantial bearish move and closes notably below the opening price of the first bullish candle. The significance of this third candle lies in its power to confirm the pattern’s validity. The stronger and more pronounced this bearish candle, the more convincing the argument for an impending trend reversal becomes. It’s often seen as the ultimate seal of approval for traders looking to take bearish positions.
In essence, the Evening Star Pattern provides traders with a window into evolving market sentiment. It’s an invaluable tool for identifying a shift from a bullish to a bearish landscape. By paying meticulous attention to each candle within the pattern and understanding its role, traders can enhance their ability to make well-informed decisions.
Formation of Evening Star Candlestick Pattern
The Evening Star Candlestick Pattern is a striking example of how candlestick charts can reveal critical market sentiments and potential reversals. It comprises three distinct candles, each representing a phase in the shift from bullish to bearish sentiment.
- Bullish Candle (Day 1): The pattern initiates with a robust bullish candle. This candle typically signifies an established uptrend, reflecting the enthusiasm of buyers. It may be driven by positive news, strong fundamentals, or a combination of factors that are pushing the price upwards.
- Indecision Candle (Day 2): Following the bullish candle, we encounter a candle with a smaller body, which often takes the form of a doji or spinning top. This candle symbolizes uncertainty and indecision among market participants. It’s as if the bulls and bears are in a brief tug-of-war, unsure of the next direction.
- Bearish Candle (Day 3): The Evening Star Pattern reaches its conclusion with a bearish candle that closes substantially below the opening price of the first bullish candle. This bearish candle is a powerful indication that the bears have taken control, and the bullish momentum is waning. It represents a significant shift in market sentiment from optimism to pessimism.
Evening Star Chart Pattern Example
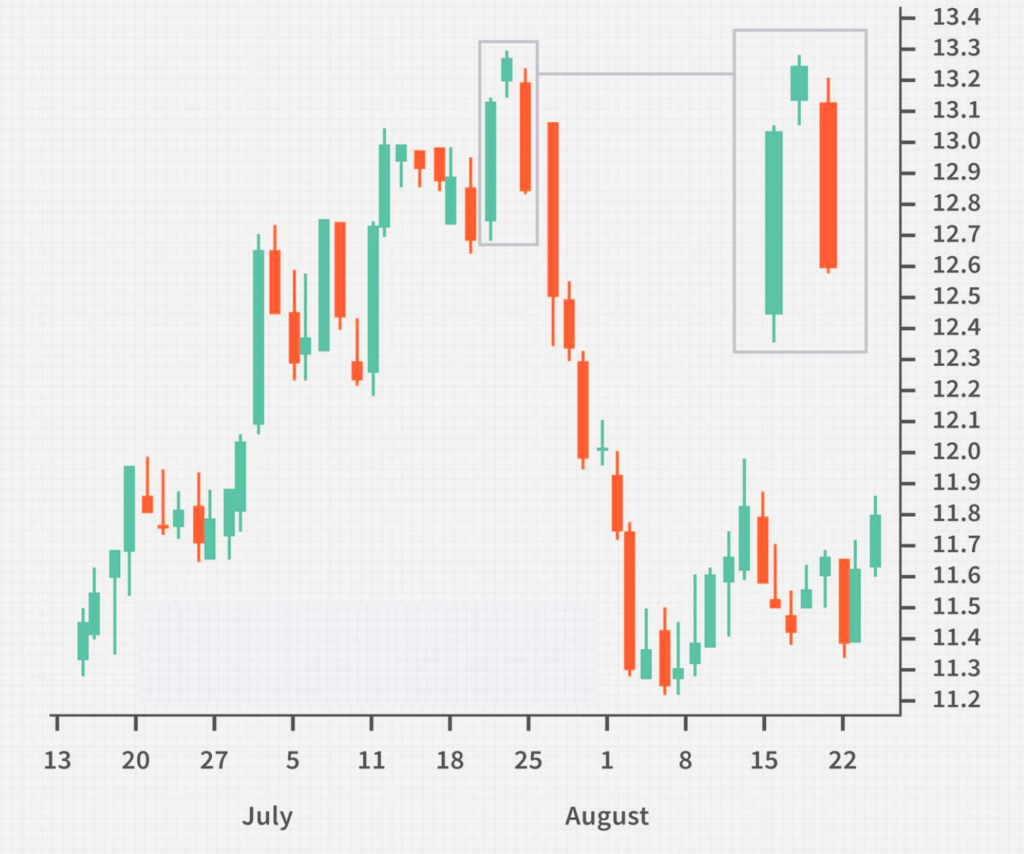
To illustrate the practical application of the Evening Star Pattern, In this chart, three distinct candlesticks form the Evening Star Pattern let’s turn our attention to a hypothetical forex chart:
Evening Star Doji
The Evening Star Pattern can be even more potent when it includes a doji candle during the indecision phase. A doji has an opening and closing price that are nearly identical, indicating a significant struggle between buyers and sellers. When a doji appears in the Evening Star Pattern, it intensifies the signal of an impending bearish reversal. It underscores the uncertainty and potential for a dramatic shift in market sentiment.
Pros and Cons of Evening Star Candlesticks
Pros:
- Effective reversal signal: The Evening Star Pattern is renowned for its reliability as a potential indicator of trend reversals, enabling traders to capitalize on changing market dynamics.
- Ease of identification: The pattern’s distinct appearance makes it relatively easy to identify on candlestick charts, even for traders with limited experience.
- Versatility: The Evening Star Pattern is versatile and can be applied to various financial markets, including stocks, forex, commodities, and cryptocurrencies.
Cons:
- False signals: No trading indicator is infallible, and the Evening Star Pattern is no exception. Occasionally, it may produce false signals, leading to poor trading decisions.
- Confirmation required: For enhanced reliability, traders often use the Evening Star Pattern in conjunction with other technical and fundamental analysis tools. Relying solely on this pattern may not always yield the desired results.
Key Takeaways:
- The Evening Star Candlestick Pattern is a potent bearish reversal pattern formed of three candles that appears after a prevailing uptrend.
- It serves as an effective signal of a potential trend reversal, prompting traders to consider selling or shorting an asset.
- While the Evening Star Pattern is a valuable tool in technical analysis, it should be part of a comprehensive trading strategy that incorporates risk management and additional forms of analysis.
- Combining the power of candlestick patterns like the Evening Star with other market insights can lead to more informed and successful trading decisions.
Conclusion:
The Evening Star Pattern emerges as a potent tool within a trader’s toolkit, offering a potential glimpse into the market’s sentiment shift from bullish to bearish. Nonetheless, it’s crucial to remember that no single technical indicator should be wielded in isolation. Instead, traders should consider a holistic approach, incorporating factors such as support and resistance levels, trading volume, and fundamental analysis when making trading decisions.
By mastering the recognition and interpretation of the Evening Star Pattern on forex charts, traders can amplify their ability to identify potential entry and exit points with precision. As is the case with any trading strategy, sound risk management practices and the use of stop-loss orders remain integral to safeguarding capital while harnessing the power of this pattern.
FAQs about Evening Star Pattern
1. What is the significance of the Evening Star Pattern in forex trading?
The Evening Star Pattern is highly significant in forex trading as it serves as a powerful bearish reversal signal. When this pattern forms after a prolonged uptrend, it suggests that the bullish momentum is weakening, and a potential trend reversal to the downside may be imminent. Forex traders often use it to time their sell or short positions.
2. Are there variations of the Evening Star Pattern?
Yes, variations of the Evening Star Pattern exist, such as the Evening Doji Star. This variation includes a doji candle in the indecision phase, making the signal even more potent. Doji candles represent strong market indecision, emphasizing the potential for a significant shift in sentiment.
3. Can the Evening Star Pattern be applied to other financial markets besides forex?
Absolutely. The Evening Star Pattern can be applied to various financial markets, including stocks, commodities, cryptocurrencies, and indices. It is a versatile technical indicator that can assist traders in identifying potential trend reversals in different asset classes.
4. How reliable is the Evening Star Pattern as a trading signal?
While the Evening Star Pattern is considered a reliable bearish reversal signal, it is not infallible. Like any technical indicator, it can produce false signals from time to time. To enhance reliability, traders often use it in conjunction with other forms of technical analysis, such as support and resistance levels and volume indicators.
5. Is it necessary to use stop-loss orders when trading based on the Evening Star Pattern?
Yes, it is highly advisable to use stop-loss orders when trading based on the Evening Star Pattern or any other technical indicator. Stop-loss orders help limit potential losses if the market moves against your position. Risk management is a crucial aspect of successful trading.
6. Can the Evening Star Pattern be used for long-term or short-term trading?
The Evening Star Pattern can be applied to various trading timeframes, from short-term to long-term. Traders often adapt its use to their specific trading strategies and time horizons. Short-term traders may use it for quick reversals, while long-term investors may use it as part of a broader trend analysis.
7. Are there other similar candlestick patterns to the Evening Star?
Yes, several other candlestick patterns indicate potential trend reversals. Some of the more common ones include the Morning Star (a bullish reversal pattern), the Harami pattern, and the Three Black Crows (a bearish continuation pattern). Each of these patterns provides unique insights into market sentiment and potential price movements.