
Table of Contents
The NR4 (Narrow Range 4) and NR7 (Narrow Range 7) trading strategy is a popular choice among traders due to its simplicity and effectiveness. This article delves into the mechanics of NR4 and NR7 patterns, explaining how they work and how traders can use them to their advantage.
What is Narrow Range Bars?
Narrow range bars, often referred to as NR bars, are specific candlestick or price bars on a chart that have a relatively small trading range compared to previous bars. The range of a bar is defined as the difference between its high and low prices during a specific period, whether it’s a minute, an hour, a day, or another timeframe, depending on the chart’s interval.
Narrow range bars are characterized by their reduced price volatility and smaller trading range. These bars indicate a period of consolidation, indecision, or reduced trading activity in the market. Traders often pay attention to narrow range bars because they can provide valuable insights into potential price movements.
Two common types of narrow range bars are:
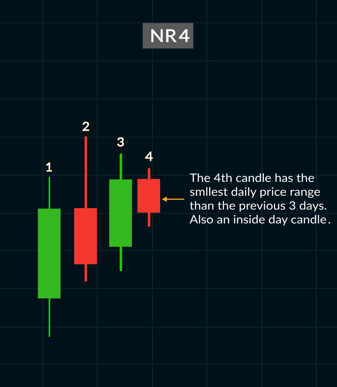
- NR4 (Narrow Range 4): An NR4 bar is one in which the range is the narrowest compared to the previous four bars. In other words, it has the smallest trading range in the last four periods.
- NR7 (Narrow Range 7): An NR7 bar is similar to NR4, but it considers the range of the last seven bars instead of four. It signifies an even more prolonged period of consolidation or reduced volatility.
Traders use narrow range bars as part of technical analysis to anticipate potential breakouts or breakdowns in the price. These bars suggest that the market is building up potential energy for a significant price move. When a narrow range bar is followed by a bar with a larger range and directional movement, it can indicate a trading opportunity.
For example, if an NR7 bar is followed by a bar with a substantial price increase, it may signal an impending bullish breakout. Conversely, if it’s followed by a bar with a significant price decrease, it could indicate a bearish breakout.
Narrow range bars are not trading signals on their own but rather a tool that traders use alongside other technical indicators and analysis techniques to make informed trading decisions. They can be found in various financial markets, including stocks, forex, commodities, and futures, and are a valuable component of technical analysis for traders looking to identify potential price reversals or continuations.
What is NR4 and NR7? Understanding the Patterns
NR4 (Narrow Range 4):
- An NR4 bar is defined as a trading day in which the range (the difference between the high and low prices) is the narrowest in the last four trading days.
- This pattern suggests a period of consolidation or indecision in the market.
NR7 (Narrow Range 7):
- An NR7 bar is similar to NR4 but considers the range of the last seven trading days.
- An NR7 pattern is even narrower, indicating a more prolonged period of consolidation.

The Logic Behind NR4 and NR7 Patterns
NR4 and NR7 patterns are based on the concept that periods of tight price ranges often precede significant price moves. When the market is indecisive or consolidating, it is building up potential energy for a breakout or breakdown. Traders can use these patterns to identify potential entry points and set their stop-loss levels.
NR4 and NR7 Trading Example
Let’s illustrate the NR4 and NR7 trading strategy with an example:
Scenario: You are a forex trader looking at the daily chart for the EUR/USD currency pair.
- Identification: You notice that on the daily chart, there is a bar that fits the criteria for an NR7 pattern. The range on this day is the narrowest compared to the previous six trading days.
- Volume Confirmation: You observe that the trading volume on this NR7 day is significantly lower than the volume on the days before and after it, confirming the pattern.
- Trade Setup: Based on your analysis, you decide to place a buy stop order slightly above the high of the NR7 bar, anticipating an upside breakout.
- Risk Management: You set a stop-loss order below the low of the NR7 bar to limit potential losses and establish a take-profit order at a reasonable target level.
- Monitoring: As the trade progresses, you monitor the price action. If the trade moves in your favor, you consider using a trailing stop to lock in profits.
- Outcome: The trade eventually breaks out to the upside, and your take-profit order is executed, resulting in a profitable trade.

This example demonstrates how the NR4 and NR7 trading strategy can be applied in practice. However, it’s crucial to remember that not all setups will result in profitable trades, and risk management remains paramount to long-term success in trading.
How to Calculate NR4, NR7 and Insider bar (IB)?
To calculate the Narrow Range 4 (NR4), Narrow Range 7 (NR7), and Inside Bar (IB) patterns, you’ll need historical price data, typically in the form of candlestick data. These patterns are identified based on the range of high and low prices over a specific number of previous bars. Here’s how you can calculate these patterns:
NR4 (Narrow Range 4):
- Calculate the trading range (high minus low) for each of the last four bars.
- Identify the bar with the narrowest trading range among the last four bars.
NR7 (Narrow Range 7):
- Calculate the trading range (high minus low) for each of the last seven bars.
- Identify the bar with the narrowest trading range among the last seven bars.
Inside Bar:
- Compare the high and low of each current bar with the high and low of the previous bar.
- If the current bar’s high is lower than or equal to the previous bar’s high, and the current bar’s low is higher than or equal to the previous bar’s low, it’s an Inside Bar (IB).
NR4 and NR7 Trading Strategy Setup
Step 1: Identify NR4 or NR7 Patterns
- Start by monitoring price charts for stocks, commodities, or currencies.
- Look for bars that fit the criteria for NR4 or NR7 patterns.
- NR4 patterns suggest short-term consolidation, while NR7 patterns indicate more extended periods of consolidation.
Step 2: Confirm the Pattern
- It’s essential to confirm the pattern by observing the volume. A significant decrease in trading volume during the NR4 or NR7 pattern is a positive sign.
Step 3: Plan Your Trade
- Once you’ve identified a valid NR4 or NR7 pattern, you can start planning your trade.
- For an NR4 pattern, consider placing a buy stop order slightly above the high of the NR4 bar if you anticipate an upside breakout. Conversely, place a sell stop order slightly below the low of the NR4 bar for a downside breakout.
- For an NR7 pattern, use a similar approach but with a longer time frame in mind. The breakout from an NR7 pattern can lead to more substantial price moves.
Step 4: Set Stop-Loss and Take-Profit Levels
- Determine your risk tolerance and set appropriate stop-loss levels below the breakout (for long trades) or above the breakout (for short trades).
- Identify potential target levels or use technical analysis tools to set your take-profit orders.
Step 5: Monitor and Manage the Trade
- Once your trade is executed, closely monitor price action.
- Be prepared to adjust your stop-loss and take-profit levels as the trade progresses.
- Consider using trailing stops to lock in profits if the trade moves in your favor.
As we delve deeper into the NR4 and NR7 trading strategy setup, it becomes evident that mastering these patterns requires a combination of technical analysis, risk management, and a deep understanding of market psychology. Here, we’ll explore these aspects in more detail to help traders develop a comprehensive approach.

Technical Analysis
- Timeframe Selection: Choosing the right timeframe is crucial when applying the NR4 and NR7 patterns. Shorter timeframes (e.g., intraday or daily) are suitable for NR4 patterns, while NR7 patterns may manifest on longer timeframes (e.g., weekly or monthly charts).
- Confirmation Indicators: To enhance the reliability of NR4 and NR7 patterns, consider incorporating technical indicators such as Moving Averages, Relative Strength Index (RSI), or Bollinger Bands. These indicators can provide additional context and confirmation of potential breakouts.
- Multiple Timeframe Analysis: Complement your primary timeframe analysis with insights from higher and lower timeframes. This holistic view can help confirm the validity of NR4 or NR7 setups and provide a more comprehensive understanding of the market’s direction.
Risk Management
- Position Sizing: Determine the size of your position based on your risk tolerance and the distance between your entry point and stop-loss level. Never risk more than you can afford to lose on a single trade.
- Stop-Loss Strategies: While setting stop-loss levels is crucial, consider using dynamic techniques such as trailing stops or moving your stop-loss to breakeven once the trade is in profit. This approach allows you to protect your gains while giving the trade room to develop.
- Diversification: Avoid overconcentration in a single asset or market. Diversifying your trading portfolio can help spread risk and reduce the impact of losses from individual trades.
Market Psychology
- Patience and Discipline: One of the challenges of trading NR4 and NR7 patterns is that they require patience. Traders must wait for the right setup to materialize, which can sometimes take time. Discipline is essential in adhering to your trading plan and avoiding impulsive decisions.
- Emotional Control: Emotions can be detrimental to trading success. Fear and greed can lead to impulsive actions, like exiting a trade prematurely or holding on too long. Recognize and manage your emotions to maintain a clear and rational mindset.
- Continuous Learning: The financial markets are dynamic, and strategies that work today may not work tomorrow. Stay updated with market news, economic events, and changes in market sentiment to adapt your trading strategy accordingly.
Backtesting and Paper Trading
Before risking real capital, it’s advisable to backtest the NR4 and NR7 strategy on historical data to assess its viability and profitability. Additionally, consider paper trading or using a demo account to practice executing trades without real money on the line. This allows you to refine your skills and build confidence in your strategy.
Interpreting NR4 and NR7
The NR4 and NR7 trading strategy is a volatility-based approach that helps traders identify potential breakouts or breakdowns in the market. It is grounded in the idea that periods of narrow price ranges often precede significant price movements. Here’s a brief overview of the strategy:
- Objective: To identify and capitalize on potential price breakouts or breakdowns following periods of consolidation.
- Key Components: Identification of NR4 and NR7 bars, confirmation through volume analysis, planning trades with specific entry and exit points, and diligent risk management.
How to Find NR7 Day?
Finding an NR7 day is the first step in implementing this strategy. Follow these steps to identify an NR7 day:
- Select the Timeframe: Choose a timeframe suitable for your trading strategy (e.g., daily, weekly, or monthly).
- Analyze Price Ranges: Examine the high and low prices of the candles or bars for the specified timeframe.
- Count the Previous Days: Determine the number of previous trading days you want to consider. For NR7, it’s seven days.
- Identify Narrowest Range: Calculate the range (high minus low) for each of the previous seven days and identify the day with the narrowest range.
- Confirm with Volume: Ensure that the day you’ve identified as NR7 also exhibits a decrease in trading volume compared to the surrounding days. This volume confirmation adds weight to the pattern.
How to Find NR4 Day?
Finding an NR4 day is similar to identifying an NR7 day but involves a shorter timeframe (four days). Here are the steps:
- Select the Timeframe: Choose the appropriate timeframe for your analysis.
- Analyze Price Ranges: Examine the high and low prices of the candles or bars within that timeframe.
- Count the Previous Days: Consider the last four trading days.
- Identify Narrowest Range: Calculate the range for each of the four days and pinpoint the day with the narrowest range.
- Confirm with Volume: As with NR7 patterns, verify that the NR4 day also has reduced trading volume compared to nearby days.
NR7 and NR4 Tweaking
Tweaking the NR7 and NR4 strategy to fit your specific trading style and preferences can help improve its effectiveness and adapt it to different market conditions. Here are some potential tweaks and enhancements you can consider:
1. Combining with Other Indicators:
- Consider using other technical indicators like Moving Averages, Relative Strength Index (RSI), or Stochastic Oscillator to provide additional confirmation of the NR4 or NR7 setup.
- For example, you might only take an NR7 breakout trade if it aligns with the trend indicated by a moving average crossover.
2. Volatility Confirmation:
- Incorporate volatility indicators such as Bollinger Bands or Average True Range (ATR) to assess whether the market is likely to experience a significant price movement following an NR4 or NR7 setup.
3. Time of Day:
- Take into account the time of day when implementing the strategy. Some traders find that NR4 and NR7 setups during the opening hours or during major economic data releases have a higher probability of success.
4. Multiple Timeframes:
- Combine NR4 and NR7 setups across multiple timeframes to get a broader perspective of the market. For instance, you might spot an NR4 setup on a shorter timeframe (e.g., 1-hour chart) that aligns with an NR7 setup on a longer timeframe (e.g., daily chart).
5. Filter for High-Impact Events:
- Avoid trading NR4 or NR7 setups during times of high-impact economic events or news releases. These events can cause erratic price movements that may not adhere to the usual patterns.
6. Backtesting and Optimization:
- Regularly backtest and optimize your NR4 and NR7 strategy on historical data to refine the parameters and rules. This can help you identify the most profitable settings and improve overall performance.
7. Combining NR4 and NR7:
- Consider using both NR4 and NR7 patterns together. This means looking for NR7 patterns on longer timeframes to identify broader consolidation periods and using NR4 patterns on shorter timeframes to pinpoint potential shorter-term breakouts within those larger ranges.
8. Pattern Recognition Software:
- Utilize pattern recognition software or trading platforms that can automatically identify NR4 and NR7 patterns for you. This can save time and help ensure you don’t miss any setups.
9. Adaptive Stop-Loss:
- Implement adaptive stop-loss strategies, such as using Average True Range (ATR) to set dynamic stop-loss levels that adjust based on market volatility.
10. Trade Management Rules:
- Develop specific rules for trade management, including when to scale in or out of a position, when to move stop-loss levels, and when to take partial profits.
Remember that tweaking any trading strategy should be done cautiously and with a clear understanding of the potential impact on risk and reward. It’s also crucial to thoroughly test any modifications on historical data or in a demo account before implementing them with real capital.
Conclusion
In conclusion, the NR4 and NR7 trading strategy setup can be a valuable addition to a trader’s toolkit when used in conjunction with a well-rounded approach. Traders should remember that no strategy guarantees success, and there will be losing trades along the way. However, by combining technical analysis, risk management, an understanding of market psychology, and continuous learning and practice, traders can increase their chances of achieving consistent profits and success in the financial markets.
FAQs about NR4 and NR7
1. What is the NR4 and NR7?
The NR4 (Narrow Range 4) and NR7 (Narrow Range 7) trading strategy is a technical analysis approach that involves identifying specific price patterns in charts. NR4 occurs when the trading range is the narrowest in the last four trading days, while NR7 occurs when it’s the narrowest in the last seven days. Traders use these patterns to anticipate potential breakouts or breakdowns.
2. How do I identify NR4 and NR7 patterns?
To identify NR4 and NR7 patterns, follow these steps:
– Select your timeframe (e.g., daily, weekly).
– Calculate the range (high minus low) for a specific number of previous trading days (4 for NR4, 7 for NR7).
– Identify the day where the range is the narrowest.
– Confirm the pattern with a decrease in trading volume compared to surrounding days.
3. What does an NR4 or NR7 pattern indicate?
An NR4 pattern suggests a short-term consolidation or indecision in the market. An NR7 pattern indicates a more prolonged consolidation. These patterns signify that the market is building up potential energy for a potential price breakout or breakdown.
4. How do I trade using NR4 and NR7 patterns?
Traders typically place buy stop orders slightly above the high of an NR4 or NR7 bar for potential upside breakouts or sell stop orders slightly below the low of the bar for downside breakouts. Stop-loss and take-profit levels are set to manage risk and lock in profits.
5. Can NR4 and NR7 patterns be used in any market?
Yes, NR4 and NR7 patterns can be applied to various markets, including stocks, forex, commodities, and futures. The strategy’s effectiveness may vary depending on the market and timeframe used.
6. Are there additional indicators that can enhance NR4 and NR7 trading?
Yes, traders often combine NR4 and NR7 patterns with other technical indicators like moving averages, RSI, MACD, or Bollinger Bands to increase the probability of successful trades. These indicators can provide additional confirmation signals.
7. What is the success rate of NR4 and NR7 patterns?
The success rate of NR4 and NR7 patterns depends on various factors, including market conditions, the timeframe used, and the trader’s skill and experience. These patterns are not foolproof and should be used in conjunction with risk management practices.
8. Is it possible to automate NR4 and NR7 pattern recognition?
Yes, it is possible to automate the identification of NR4 and NR7 patterns using algorithmic trading systems or custom scripts in trading platforms. However, it’s essential to ensure that the automated system is well-tested and reliable.
9. Can NR4 and NR7 patterns be used for both day trading and longer-term investing?
Yes, NR4 and NR7 patterns can be adapted for various trading styles, including day trading, swing trading, and longer-term investing. The choice of timeframe and trading strategy should align with your specific goals and risk tolerance.