Table of Contents
Pin Bar trading has risen to prominence due to its reliability in pinpointing potential market reversals and trend continuations. In this extensive guide, we will delve deeply into the intricacies of Pin Bar trading, exploring not only what Pin Bars are but also how to identify them accurately and the strategic approaches to effectively trade using these candlestick patterns.
What is a Pin Bar Pattern?
A Pin Bar, short for “Pinocchio Bar,” is a single candlestick pattern that materializes on a price chart. At its core, it’s characterized by two fundamental elements that offer critical insights into market dynamics:
- The Extended Wick: The most conspicuous feature of a Pin Bar is the extended wick, or tail, which can be significantly longer than the body of the candle. The wick represents a sharp and sudden reversal in price action during a particular time interval.
- The Compact Body: Adjacent to the extended wick, you will find a compact body, often referred to as the “nose” of the Pin Bar. This body symbolizes the opening and closing prices within that time period.
Primary Pin Bar Signals
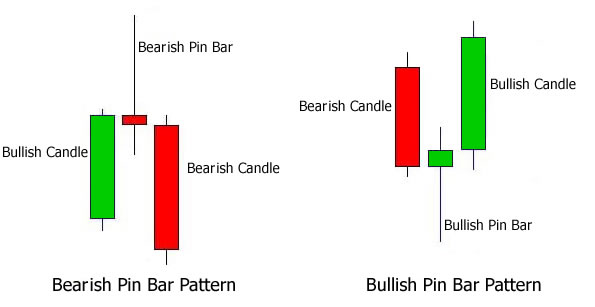
The primary significance of Pin Bars lies in their ability to provide traders with valuable information regarding market sentiment and the potential direction of price movements. There are two primary categories of Pin Bars:
- Bullish Pin Bar:
- The elongated wick extends below the small body.
- Suggests a probable reversal from a preceding downtrend to a nascent uptrend.
- It reflects bullish sentiment as buyers take control and push prices higher after a significant decline.
- Bearish Pin Bar:
- The lengthy wick extends above the small body.
- Implies a likely reversal from a prior uptrend to a developing downtrend.
- It conveys bearish sentiment as sellers regain control and drive prices lower after a notable rally.
6 Types of Pin Bars
Let’s explore additional details about the various types of Pin Bars, including specific characteristics and trading implications for each type:
1. Long-Tailed Pin Bar:
- Characteristics: The long-tailed Pin Bar, also known as the “Nose Bar” or “Dragonfly Doji” (bullish) and “Gravestone Doji” (bearish), is distinguished by an exceptionally long wick (shadow) that is significantly longer than the body. The body can be small, and it often closes near the open price.
- Trading Implications (Bullish): A long-tailed Pin Bar with a long lower wick suggests strong rejection of lower prices. It indicates potential bullish sentiment and a possible reversal in a downtrend. Traders may interpret this pattern as an opportunity to enter long positions.
- Trading Implications (Bearish): A long-tailed Pin Bar with a long upper wick signifies strong rejection of higher prices. It implies potential bearish sentiment and a potential reversal in an uptrend. Traders may see this as a signal to enter short positions.
2. Hammer and Hanging Man:
- Hammer (Bullish):
- Characteristics: The Hammer has a small body near the upper end of the candlestick range and a long lower wick. It resembles a hammer, hence the name.
- Trading Implications: The Hammer suggests that bears attempted to push the price lower but failed, indicating a potential bullish reversal. It’s especially powerful when it forms after a downtrend.
- Hanging Man (Bearish):
- Characteristics: The Hanging Man has a small body near the upper end of the range and a long lower wick. It resembles a man hanging from a noose.
- Trading Implications: The Hanging Man suggests that bulls attempted to push the price higher but failed, indicating a potential bearish reversal. It’s most effective when it forms after an uptrend.
3. Shooting Star:
- Characteristics: The Shooting Star has a small body near the lower end of the range and a long upper wick. It resembles a star falling from the sky.
- Trading Implications: The Shooting Star signifies that bulls attempted to push the price higher but failed, indicating a potential bearish reversal. It’s typically observed after an uptrend and is considered a strong bearish signal.
4. Bullish and Bearish Engulfing Pin Bars:
- Bullish Engulfing Pin Bar:
- Characteristics: This pattern forms when a smaller bearish Pin Bar (with a small body and long wicks) is followed by a larger bullish Pin Bar that completely engulfs the previous candlestick, including its body and wicks.
- Trading Implications: A Bullish Engulfing Pin Bar suggests a shift from bearish to bullish sentiment, indicating potential upward momentum. It’s a strong reversal signal.
- Bearish Engulfing Pin Bar:
- Characteristics: This pattern forms when a smaller bullish Pin Bar is followed by a larger bearish Pin Bar that completely engulfs the previous candlestick, including its body and wicks.
- Trading Implications: A Bearish Engulfing Pin Bar suggests a shift from bullish to bearish sentiment, indicating potential downward momentum. It’s a robust reversal signal.
5. Pin Bar Reversal and Continuation:
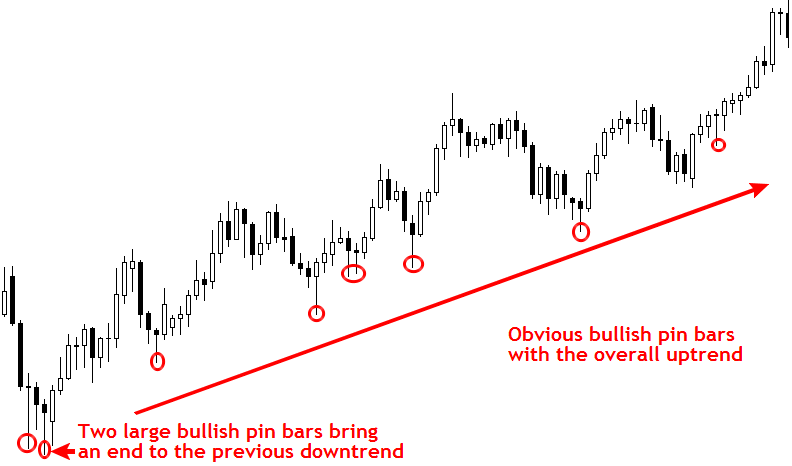
- Characteristics: Pin Bars can also be classified as reversal or continuation patterns based on their location within the trend. In an uptrend, a bearish Pin Bar can indicate a potential reversal, while a bullish Pin Bar may suggest a continuation of the uptrend. Conversely, in a downtrend, a bullish Pin Bar can signal a potential reversal, while a bearish Pin Bar may indicate a continuation of the downtrend.
6. Doji and Spinning Top as Indecision Pin Bars:
- Doji: A Doji is a candlestick with a small body and long wicks, where the open and close prices are nearly the same. It suggests market indecision and can act as a Pin Bar when it forms after a significant price move.
- Spinning Top: A Spinning Top has a small body and long upper and lower wicks, indicating uncertainty and indecision in the market. Like a Doji, it can function as a Pin Bar in specific contexts.
How to Trade Using Pin Bars?
Trading with Pin Bars is not just about spotting the patterns but also about crafting a well-rounded strategy to make informed decisions. Here, we delve deeper into the intricacies of trading with Pin Bars, providing additional details and strategies:
1. Confirming the Pin Bar Pattern: Before entering a trade solely based on a Pin Bar pattern, it’s essential to confirm its validity. This confirmation can be achieved through various means:
- Location: Consider the location of the Pin Bar on the chart. Is it occurring near a significant support or resistance level, trendline, or key Fibonacci retracement level? Pin Bars that form at these strategic locations tend to carry more weight.
- Volume: Analyze trading volume during the formation of the Pin Bar. An increase in volume, especially on a reversal Pin Bar, can lend further credibility to the signal, suggesting increased market participation.
- Confirmation Candle: Wait for a confirmation candle to follow the Pin Bar. A bullish Pin Bar should be followed by a bullish candle, and a bearish Pin Bar should be followed by a bearish candle. Entering the trade only after this confirmation candle closes can reduce false signals.

2. Use of Stop-Loss and Take Profit Orders: Proper risk management is paramount when trading with Pin Bars. Implementing stop-loss and take-profit orders is crucial:
- Stop-Loss Placement: Determine your stop-loss level based on the Pin Bar’s low for a bullish Pin Bar or high for a bearish Pin Bar. This level represents the point at which your trade will be exited if the market moves against your position. Consider placing your stop-loss slightly beyond these levels to account for market noise and avoid premature stop-outs.
- Take-Profit Targets: Define your take-profit levels using technical analysis tools, such as support and resistance levels, Fibonacci extensions, or trendline projections. Setting realistic take-profit targets ensures you capture profits while avoiding excessive greed.
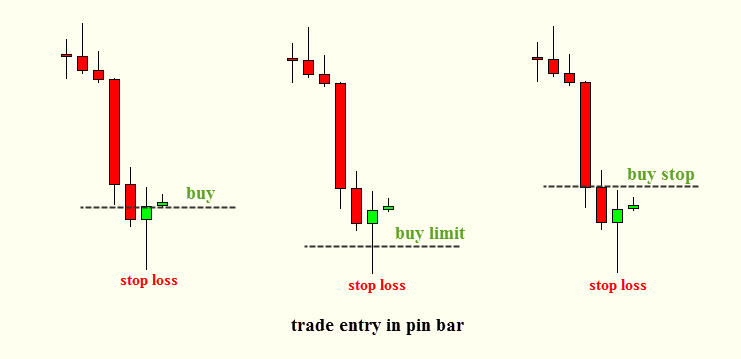
3. Trailing Stop Strategies: Trailing stops can be employed to protect profits and maximize gains as the trade moves in your favor:
- Chandelier Exit: This is a dynamic trailing stop method that adjusts the stop-loss level based on market volatility. As volatility increases, the Chandelier Exit tightens the stop, helping to lock in profits.
- Fixed Percentage Trailing Stop: Determine a fixed percentage (e.g., 1% or 2%) by which the stop-loss is adjusted as the trade progresses in your favor. This allows you to capture more significant gains during strong trends.
4. Multiple Timeframe Analysis: Combining multiple timeframes enhances the reliability of Pin Bar signals:
- Long-Term Confirmation: Utilize higher timeframes, such as daily or weekly charts, to identify long-term trends and significant support/resistance levels. A Pin Bar on a higher timeframe can provide more substantial trade opportunities.
- Entry on Lower Timeframes: After identifying a Pin Bar on a higher timeframe, switch to lower timeframes, like hourly or 15-minute charts, to pinpoint precise entry points. Look for smaller Pin Bars or consolidation patterns that align with the direction indicated by the higher timeframe Pin Bar.
5. Risk-Reward Ratio: Maintain a favorable risk-reward ratio to ensure that your potential reward outweighs your risk. A common guideline is to aim for a ratio of at least 1:2, meaning that the potential profit should be at least twice the size of your initial risk (stop-loss). Adhering to this principle helps you achieve consistent profitability over time.
6. Trade Management and Scaling In/Out: As the trade progresses, consider scaling in or out of positions:
- Scaling In: If the trade moves in your favor, you may add to your position, provided that market conditions remain favorable. This strategy allows you to increase your exposure to a winning trade.
- Scaling Out: Gradually exit portions of your position as the trade approaches your take-profit targets. Scaling out ensures you lock in profits and reduces the risk of sudden reversals.
7. Continuous Learning and Review: Trading with Pin Bars, like any other strategy, requires continuous learning and review of your trades:
- Keep a Trading Journal: Document your Pin Bar trades, including the rationale for entry and exit, the timeframes used, and the outcome. Regularly reviewing your journal helps you identify patterns in your trading and areas for improvement.
- Stay Informed: Stay updated on market news and events that can impact your trades. Pin Bars can react to unexpected news, so it’s essential to be aware of economic calendars and potential market-moving events.
How to Spot a Pin Bar Pattern?
Selecting the Right Chart and Timeframe:
- Chart Selection: Begin by selecting the financial instrument you wish to analyze, whether it’s a currency pair, stock, commodity, or cryptocurrency. Ensure you have access to a reliable charting platform with candlestick charts.
- Timeframe Choice: Choose an appropriate timeframe based on your trading style and objectives. Common timeframes include daily, hourly, 4-hour, or 15-minute charts. Longer timeframes provide a broader perspective, while shorter timeframes offer more immediate insights.
Identifying Potential Pin Bars:
- Small Body: Look for candlestick patterns with a small body. The body of the Pin Bar represents the difference between the open and close prices during the candle’s timeframe. A small body indicates indecision or a potential reversal.
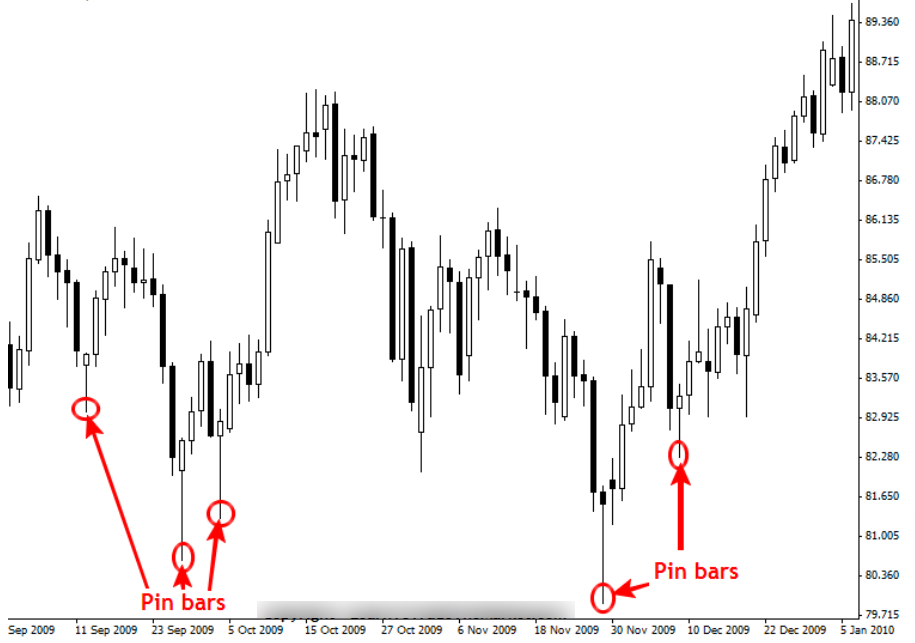
- Long Wick: Examine the length of the wick (also known as the shadow) relative to the body. A valid Pin Bar should have a significantly longer wick compared to the body. This extended wick signifies a rejection of higher or lower prices.
- Wick Position: Pay attention to the location of the wick in relation to the body:
- For a bullish Pin Bar (reversal signal), the long wick should be positioned below the body, indicating that buyers rejected lower prices.
- For a bearish Pin Bar (reversal signal), the long wick should be positioned above the body, showing that sellers rejected higher prices.

Understanding Candlestick Anatomy:
- Upper Shadow: The upper shadow is the portion of the wick above the body. For a bearish Pin Bar, this is the part of the wick that extends above the body. For a bullish Pin Bar, it’s the lower part of the wick.
- Lower Shadow: The lower shadow is the part of the wick below the body. For a bearish Pin Bar, it’s the lower part of the wick. For a bullish Pin Bar, it’s the upper part of the wick.
- Real Body: The real body represents the price range between the open and close. It is typically colored differently (e.g., filled or hollow) to indicate whether the close was higher (bullish) or lower (bearish) than the open.
Confirmation and Context:
- Confirmation Candle: To enhance the reliability of the Pin Bar signal, consider waiting for a confirmation candle to form after the Pin Bar. A confirmation candle that moves in the direction indicated by the Pin Bar strengthens the signal.
- Market Context: Always assess the broader market context when spotting Pin Bars. Consider factors such as the prevailing trend, recent price action, and major support/resistance levels. A Pin Bar that aligns with the overall market context is more likely to be significant.
Using Technical Indicators and Tools:
- Moving Averages: Incorporate moving averages into your analysis. Pin Bars that form near or at key moving averages, such as the 200-day or 50-day moving average, can carry additional significance.
- Fibonacci Retracement Levels: Overlay Fibonacci retracement levels on your chart and look for Pin Bars that coincide with these levels. Pin Bars forming at key Fibonacci levels (e.g., 38.2%, 50%, or 61.8%) can provide strong trade setups.
Practice and Pattern Recognition:
- Pattern Recognition: Regularly practice recognizing Pin Bars and other candlestick patterns. Over time, you’ll develop a more intuitive sense for spotting these patterns quickly.
- Pattern Recognition Software: Consider using pattern recognition software or indicators available on some trading platforms. These tools can automatically identify and highlight Pin Bars and other candlestick patterns on your charts.
Mentorship and Learning:
- Learn from Experts: Seek mentorship or educational resources from experienced traders who specialize in candlestick analysis. They can provide valuable insights and practical tips for spotting Pin Bars effectively.
Customization and Personalization:
- Customize Your Charts: Tailor your chart settings to make Pin Bars more visually distinct. Adjust colors, line styles, or chart backgrounds to highlight Pin Bars for easier identification.
Continuous Learning and Testing:
- Backtesting: Test your ability to spot Pin Bars on historical data to refine your skills. Analyze how Pin Bars have performed in different market conditions to gain insights into their reliability.
- Keep Learning: Stay updated on the latest developments in candlestick analysis and technical analysis as a whole. The financial markets are dynamic, and continuous learning is essential for successful trading.
By applying these techniques and refining your ability to spot Pin Bars accurately, you can enhance your trading decisions and increase the likelihood of identifying potential reversals and trend continuations effectively.
Pin Bar Trading Strategies
Successful Pin Bar trading extends beyond merely recognizing the patterns. It necessitates the development and execution of a comprehensive trading strategy. Here are some essential strategies that traders commonly employ when integrating Pin Bars into their trading:
Multiple Timeframes Analysis: Trading with Pin Bars becomes more robust when you incorporate multiple timeframes into your analysis. This strategy involves examining Pin Bars on various timeframes to gain a more comprehensive understanding of market sentiment and potential reversals.
- Higher Timeframe Confirmation: Start by analyzing Pin Bars on higher timeframes, such as daily or weekly charts, to identify long-term trends and major support/resistance levels. A Pin Bar on a higher timeframe can provide a stronger signal for a more extended move.
- Entry on Lower Timeframes: After identifying a Pin Bar on a higher timeframe, switch to lower timeframes, like hourly or 15-minute charts, to pinpoint precise entry points. Look for smaller Pin Bars or consolidation patterns that align with the direction indicated by the higher timeframe Pin Bar.
- Consistency Across Timeframes: The key here is to ensure consistency in the signals across multiple timeframes. When a Pin Bar on a lower timeframe confirms the sentiment of a Pin Bar on a higher timeframe, it enhances the reliability of the trade setup.
Pin Bar Combo Patterns: Pin Bar Combo Patterns involve the identification of multiple candlestick patterns occurring in close proximity. By recognizing these combinations, traders can find high-probability trade setups.
- Example: Look for a Pin Bar followed by an Engulfing pattern or a Doji. This combination can strengthen the validity of the Pin Bar signal, providing more confidence in your trade decisions.
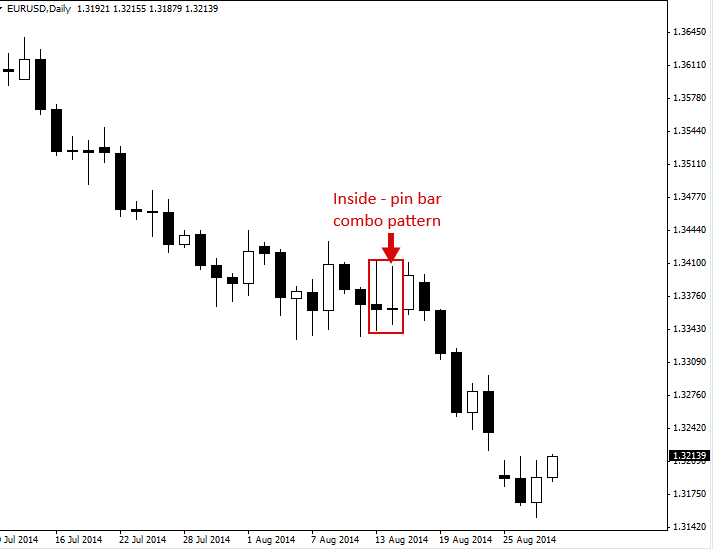
Trading Pin Bars against the Trend, From Key Chart Levels: Contrarian traders often seek opportunities to trade Pin Bars against the prevailing trend. This strategy involves identifying Pin Bars that signal potential reversals from key chart levels.
- Identification: Pin Bars forming at strong support or resistance levels are often indicative of trend exhaustion. When trading against the trend, traders aim to capture short-term countertrend moves.
- Risk Management: Since trading against the trend carries higher risk, it’s crucial to employ strict risk management techniques, including tight stop-loss orders and smaller position sizes.
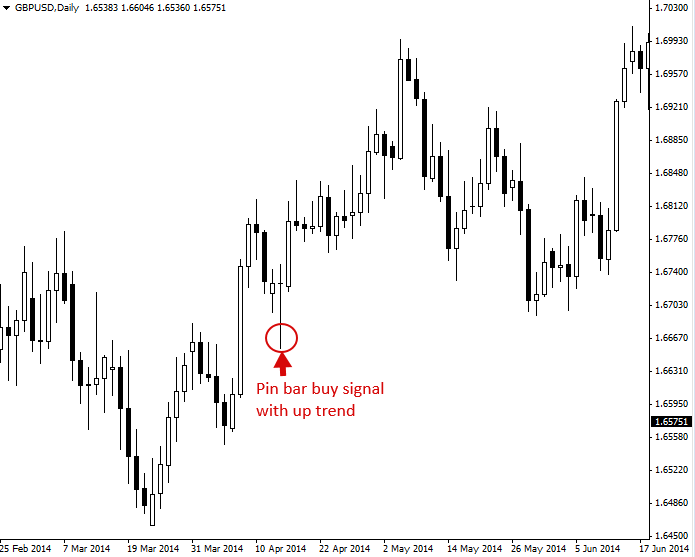
Trading Pin Bar Signals in a Trending Market: In a trending market, traders can use Pin Bars to find entry points in the direction of the trend.
- Trend Confirmation: Look for Pin Bars that align with the prevailing trend. For instance, in an uptrend, focus on bullish Pin Bars; in a downtrend, prioritize bearish Pin Bars.
- Pullback Entries: Pin Bars that occur after a pullback in a trending market can offer attractive entry points. Traders aim to join the trend at favorable prices.
Double Top/Bottom Strategy: A Double Top or Bottom is a chart pattern characterized by two distinct price peaks (Double Top) or troughs (Double Bottom) at approximately the same level. Pin Bars can play a role in identifying potential reversals from these patterns.
- Confirmation with Pin Bars: When a Pin Bar forms near the second peak (Double Top) or trough (Double Bottom), it can validate the pattern and signal a reversal. This strategy is particularly useful for swing traders.
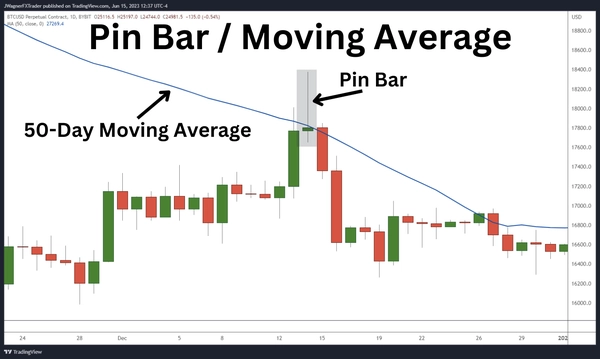
Moving Average Bounce/Rejection Strategy: Combining Pin Bars with moving averages can be effective in trend following and reversal strategies.
- Bounce from Moving Averages: Look for Pin Bars that form near a moving average and indicate a potential bounce. In an uptrend, bullish Pin Bars near a rising moving average can signal a continuation of the trend.
- Rejection from Moving Averages: Conversely, in a downtrend, bearish Pin Bars near a declining moving average can suggest a rejection and potential trend continuation.
Inside Bar Breakout Strategy: The Inside Bar is a candlestick pattern where the current candle’s price range is entirely contained within the previous candle’s range. When an Inside Bar forms within the context of a Pin Bar, it can provide a powerful breakout trading opportunity.
- Identification: Look for an Inside Bar that forms within the high and low of the Pin Bar. This pattern suggests a period of consolidation and potential pent-up market energy.
- Trading Strategy: Trade the breakout of the Inside Bar in the direction of the Pin Bar’s long wick. Use a stop-loss order below the Inside Bar’s low (for a bullish Pin Bar) or above the Inside Bar’s high (for a bearish Pin Bar).
Pin Bar Reversal with Divergence: Divergence occurs when the price of an asset moves in the opposite direction of a technical indicator, such as the Relative Strength Index (RSI) or Moving Average Convergence Divergence (MACD). Combining Pin Bars with divergence can enhance reversal signals.
- Bullish Divergence: When a bullish Pin Bar forms near a support level, and an oscillator like the RSI forms higher lows, it indicates bullish divergence and strengthens the case for a reversal.
- Bearish Divergence: In a bearish Pin Bar scenario near a resistance level, if an oscillator like the RSI forms lower highs, it suggests bearish divergence and reinforces the potential for a reversal.
Pin Bar Scalping: Scalpers aim to profit from small price movements within short timeframes. Pin Bars can be incorporated into scalping strategies for quick, high-frequency trading.
- 1-Minute Charts: Use very short timeframes like 1-minute charts to spot Pin Bars. Scalpers may enter and exit positions rapidly, targeting minimal price fluctuations.
- Tight Stop-Loss: Employ tight stop-loss orders to manage risk effectively, as scalping strategies often involve numerous trades in a short period.
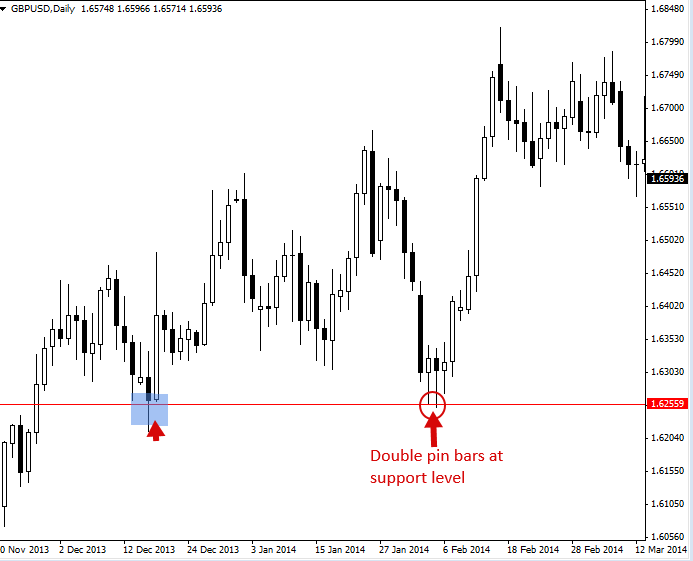
Confluence of Multiple Pin Bars: Look for instances where multiple Pin Bars align with each other or with other technical analysis factors, such as support/resistance levels, trendlines, or moving averages.
- Double or Triple Pin Bars: When two or three Pin Bars form in close proximity, it can signal strong market sentiment in that direction, increasing the probability of a successful trade.
- Confluence with Other Indicators: Combine Pin Bars with other technical indicators, like Stochastic Oscillator or Bollinger Bands, that provide additional confirmation for your trading decisions.
Combining Pin Bars with Trendlines and Support/Resistance: To refine your Pin Bar trading strategy, consider combining Pin Bars with other technical tools like trendlines and support/resistance levels for more robust trade setups.
- Trendline Breaks: Look for Pin Bars that coincide with a break or bounce off a trendline. A Pin Bar forming at or near a trendline adds significant confluence to the trade, signaling a potential trend reversal or continuation.
- Support and Resistance Zones: Pin Bars that form at key support or resistance levels carry added significance. These levels are where price has previously struggled, and a Pin Bar forming here can indicate a potential reversal or breakout.
- Swing Points: Identify significant swing points on your chart where price has changed direction in the past. Pin Bars forming at these levels often suggest strong reversal potential.
Pin Bar with Confluence Patterns: Incorporating confluence patterns with Pin Bars enhances the reliability of your trading strategy. Confluence patterns are combinations of different technical signals that align in the same direction.
- Engulfing Patterns: Look for engulfing patterns that confirm the Pin Bar signal. An engulfing pattern is a candlestick pattern where the body of the current candle completely engulfs the body of the previous one. It can provide added confirmation of the Pin Bar’s direction.
- Fibonacci Retracement Levels: Combine Pin Bars with Fibonacci retracement levels to identify potential reversal zones. Pin Bars occurring at Fibonacci levels like 38.2%, 50%, or 61.8% can offer strong trade setups.
Divergence and Pin Bars: Divergence is another valuable tool to use alongside Pin Bars. Divergence occurs when the price and a technical indicator (e.g., RSI or MACD) move in opposite directions, signaling a potential reversal.
- Bullish Divergence: When a Pin Bar forms at a support level while an oscillator like the RSI forms higher lows, it suggests bullish divergence. This can strengthen the case for a bullish reversal.
- Bearish Divergence: Conversely, when a Pin Bar forms at a resistance level while an oscillator forms lower highs, it indicates bearish divergence. This can provide additional confirmation for a bearish reversal.
News and Event Consideration: Pay attention to scheduled economic events, news releases, and earnings reports that can impact the markets. Sometimes, a Pin Bar may form as a reaction to unexpected news, leading to significant market moves.
- Fundamental Analysis: Combine your Pin Bar analysis with fundamental analysis to assess how news events and economic data may affect the market sentiment. Be cautious when trading around major news events, as volatility can be high.
- Earnings Reports: For stocks, consider the impact of earnings reports on price action. A Pin Bar forming after a company’s earnings announcement can indicate a significant shift in market sentiment.
Advantages and Disadvantages of the Pin Bar Pattern
Advantages:
- Clear Reversal Signals: One of the most significant advantages of the Pin Bar pattern is its ability to provide clear and visually distinct signals for potential reversals. Traders can readily identify Pin Bars on their charts, making them an accessible tool for both novice and experienced traders.
- Versatility Across Markets: Pin Bars are versatile and can be applied across various financial markets, including forex, stocks, commodities, and cryptocurrencies. They are effective on different timeframes, from intraday to long-term charts, making them suitable for traders with diverse preferences.
- Risk Management: Pin Bars offer traders precise entry and stop-loss points. This feature aids in effective risk management by allowing traders to determine their potential losses in advance. This clarity is especially valuable for disciplined traders who prioritize capital preservation.
- Confluence with Other Indicators: The Pin Bar pattern can be used in conjunction with other technical indicators, such as moving averages, RSI, MACD, and trendlines. When Pin Bars align with signals from these indicators, it adds an extra layer of confirmation to trading decisions, increasing their reliability.
- Entry Point Precision: Pin Bars provide well-defined entry points. Traders often enter positions when price retraces to the small body of the Pin Bar, aiming for precise entry levels and minimizing slippage.
Disadvantages:
- False Signals: A significant limitation of the Pin Bar pattern is the potential for false signals. Not every Pin Bar leads to a successful trade. False signals can occur, especially in markets characterized by erratic or choppy price movements. Traders must exercise caution and consider additional factors to filter out unreliable signals.
- Subjectivity in Identification: Identifying Pin Bars can be somewhat subjective, as different traders may interpret them differently. This subjectivity can lead to discrepancies in signal identification. To mitigate this, traders often rely on specific criteria, such as the length of the wick relative to the body, to reduce subjectivity.
- Market Context Matters: The effectiveness of Pin Bars heavily depends on market context. In trending markets, Pin Bars tend to be more reliable, signaling potential reversals or trend continuations. However, in sideways or ranging markets, Pin Bars may produce less consistent results. Traders must consider broader market conditions alongside Pin Bar signals.
- Not a Standalone Strategy: While Pin Bars are a valuable component of technical analysis, they are not a standalone trading strategy. Relying solely on Pin Bars without considering other factors, such as fundamental analysis, overall market sentiment, or economic events, can be risky. Effective trading often involves a multifaceted approach.
- Risk of Overtrading: Traders, particularly beginners, might be tempted to overtrade when they spot multiple Pin Bars on their charts. Overtrading can lead to higher transaction costs and increased exposure to market volatility. It’s essential to maintain discipline and only execute trades that meet your predetermined criteria.
- Limited to Historical Data: Like all technical analysis tools, Pin Bars are based on historical price data. They provide insights into past market behavior but cannot predict future price movements with certainty. Traders should be aware that past performance does not guarantee future results.
Conclusion
The Pin Bar trading strategy is a potent weapon in a trader’s arsenal for identifying potential reversals and trend continuations across diverse financial markets. By thoroughly comprehending the components of Pin Bars, perfecting the skill of identifying them on price charts, and executing effective trading strategies, you can enhance your odds of making well-informed and profitable trading decisions. Nevertheless, it’s imperative to remember that, like any trading strategy, Pin Bar analysis should be coupled with rigorous risk management and a commitment to continuous learning to excel in the dynamic world of trading.
FAQs about Pin Bar Trading Pattern
Here are some frequently asked questions (FAQs) related to Pin Bar trading patterns.
1. What is a Pin Bar pattern?
A Pin Bar, or Pinocchio Bar, is a candlestick pattern characterized by a small body and a long wick (shadow) that extends significantly beyond the body. It is considered a reversal or continuation pattern, depending on its location within the trend.
2. How do I spot a Pin Bar pattern accurately?
To spot a Pin Bar accurately, follow these steps:
1. Look for a small body relative to the wick.
2. Ensure the wick is significantly longer than the body.
3. Check the wick’s position; it should be on one side of the body, indicating bullish or bearish sentiment.
4. Consider the broader market context and potential confirmation candles.
3. What are the different types of Pin Bars?
There are various types of Pin Bars, including:
1. Long-Tailed Pin Bar
2. Hammer and Hanging Man
3. Shooting Star
4. Bullish and Bearish Engulfing Pin Bars
5. Pin Bars as Reversal and Continuation Patterns
6. Doji and Spinning Top as Indecision Pin Bars
4. Can I use Pin Bars for day trading?
Yes, Pin Bars can be applied to day trading by using shorter timeframes and adjusting trading strategies to capitalize on intraday price movements.
5. How do I avoid false Pin Bar signals?
To minimize false signals, consider additional confirmation indicators, analyze the broader market context, and use proper risk management techniques like stop-loss orders.
6. What is a favorable risk-reward ratio when trading Pin Bars?
A common guideline is to maintain a risk-reward ratio of at least 1:2, meaning that the potential reward should be at least twice the size of the risk (stop-loss). However, this ratio can vary depending on your trading strategy and risk tolerance.
7. Are Pin Bars suitable for all market conditions?
While Pin Bars are effective in trending markets, they may lose their effectiveness in choppy or sideways markets. Traders should assess the prevailing market conditions before solely relying on Pin Bar signals.
8. How can I combine Pin Bars with other technical analysis tools?
Pin Bars can be combined with various technical indicators like moving averages, Fibonacci retracement levels, trendlines, and oscillators to increase the reliability of your trading decisions.
9. Can Pin Bars be used in conjunction with other candlestick patterns?
Yes, traders often combine Pin Bars with other candlestick patterns like Doji, Engulfing patterns, and Harami for a more comprehensive analysis, enhancing the strength of their trade setups.
10. Is there any specific Pin Bar strategy that consistently works?
There is no one-size-fits-all Pin Bar strategy that guarantees success. Success depends on various factors, including market conditions, risk management, and your overall trading approach. It’s essential to customize your strategy based on your trading style and preferences.
