
Table of Contents
The Relative Strength Index (RSI) is a versatile and widely embraced momentum oscillator in the world of technical analysis. Created by J. Welles Wilder Jr. in the late 1970s, the RSI has earned its place as a cornerstone of trading strategies, helping market participants identify overbought and oversold conditions and make calculated trading decisions. In this article, we’ll explore what the RSI index strategy is, how it works, and how traders can utilize it effectively.
What is Relative Strength Index (RSI)?
RSI stands for “Relative Strength Index,” and it is a popular technical indicator used in financial markets, particularly in the analysis of stocks, commodities, and currencies. RSI is a momentum oscillator that measures the speed and change of price movements, helping traders and analysts identify overbought or oversold conditions in an asset.
What is the RSI Index?
The RSI is a momentum oscillator that measures the speed and change of price movements. It oscillates between 0 and 100 and is typically used to identify potential trend reversals and market entry or exit points. The RSI is calculated using the following formula:
RSI = 100 – (100 / (1 + RS))
Where:
- RS (Relative Strength) = Average Gain / Average Loss
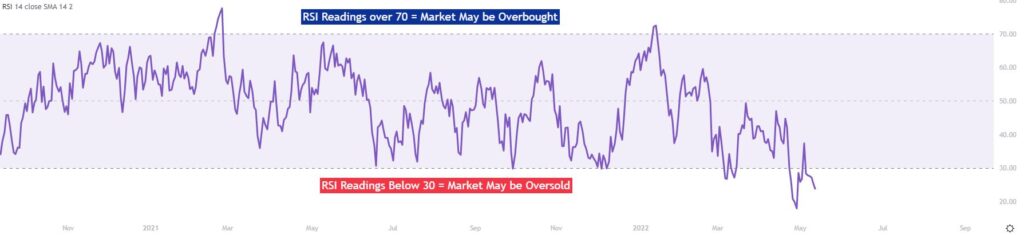
Understanding RSI Readings:
- Overbought (Above 70): When the RSI rises above the 70 level, it suggests that the asset may be overbought, and a potential reversal or correction might be on the horizon. Traders often consider this a signal to sell or take profits.
- Oversold (Below 30): Conversely, when the RSI falls below the 30 level, it indicates that the asset may be oversold, and a potential reversal to the upside could occur. Traders often see this as a signal to buy or enter long positions.
How Relative Strength Index (RSI) Calculated?
The Relative Strength Index (RSI) is a popular momentum oscillator used in technical analysis to assess the strength and potential reversal points of price movements in financial markets. It is calculated using a formula based on the average gains and losses over a specified period. Here’s a step-by-step explanation of how the RSI is calculated:
Step 1: Select a Time Period
The first step in calculating the RSI is to choose a specific time period over which you want to calculate the indicator. The most common period used is 14, meaning that you will look at the price data over the past 14 periods (e.g., 14 days for daily charts) to compute the RSI. However, traders can adjust this period to their preference.
Step 2: Calculate Average Gain and Average Loss
Next, you need to calculate the average gain and average loss over the chosen period. To do this, you follow these sub-steps:
a. Calculate the daily price changes for each period. You subtract the previous day’s closing price from the current day’s closing price.
Daily Price Change = Current Day’s Close – Previous Day’s Close
b. Determine whether each daily price change is a gain or a loss. If the daily price change is positive, it’s considered a gain. If it’s negative, it’s considered a loss.
- If Daily Price Change > 0, it’s a Gain.
- If Daily Price Change < 0, it’s a Loss.
c. Calculate the average gain and average loss over the specified period. You sum up all the gains and losses separately and then divide by the chosen period (e.g., 14) to get the average values.
Average Gain = (Sum of gains over the period) / Period
Average Loss = (Sum of losses over the period) / Period
Step 3: Calculate Relative Strength (RS)
The Relative Strength (RS) is the ratio of the average gain to the average loss:
RS = Average Gain / Average Loss
Step 4: Calculate the RSI
Finally, you use the RS value to calculate the RSI itself using the following formula:
RSI = 100 – (100 / (1 + RS))
This formula converts the RS ratio into an oscillator that typically ranges from 0 to 100. The RSI provides insight into whether an asset is overbought or oversold. An RSI above 70 often suggests overbought conditions, while an RSI below 30 suggests oversold conditions.
To summarize, the RSI is calculated by determining the average gains and losses over a specified period and then using those values to calculate the relative strength (RS), which is then transformed into the RSI value using the final formula. Traders use RSI to identify potential buying and selling opportunities and to gauge the strength of price trends.
7 RSI Trading Strategies
An RSI (Relative Strength Index) trading strategy uses the RSI indicator to make trading decisions based on various signals and patterns generated by the indicator. Here are seven common RSI trading strategies:
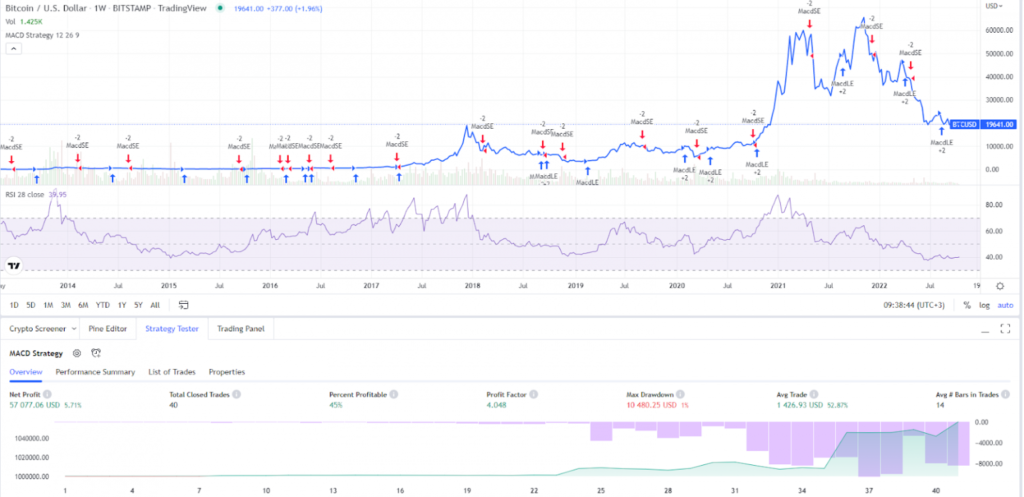
- Moving Average Convergence Divergence (MACD): Combining RSI with other technical indicators like MACD can provide a more comprehensive view of market conditions. Traders often look for confirmations between indicators before making trading decisions.
- Use in Different Timeframes: The RSI strategy can be applied to various timeframes, from short-term day trading to long-term investing. Different timeframes can provide different signals, so traders should choose the timeframe that aligns with their trading goals.
- Centerline Crossovers: The RSI can also be used to identify trends. A move above the 50 level can be interpreted as a bullish signal, indicating potential upward momentum. Conversely, a move below 50 suggests bearish momentum.
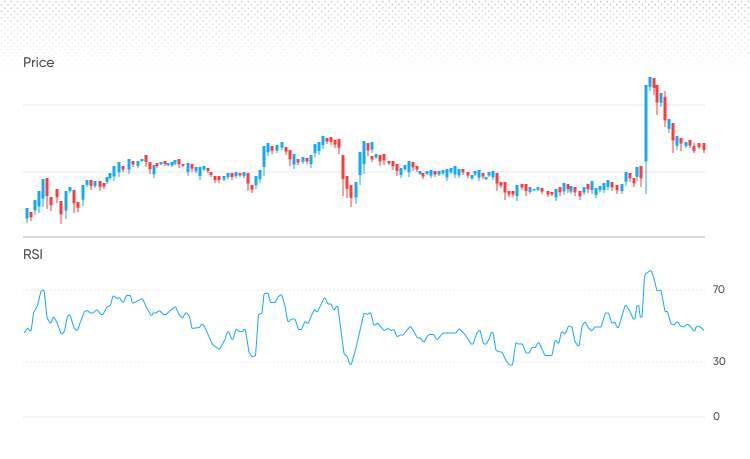
- Overbought and Oversold Strategy:
- Overbought: When the RSI crosses above 70, it’s considered overbought, suggesting that the asset’s price has risen too rapidly and may be due for a correction. Traders following this strategy might consider selling or taking profits.
- Oversold: When the RSI crosses below 30, it’s considered oversold, indicating that the asset’s price has fallen too rapidly and may be due for a rebound. Traders might consider buying or entering a long position.
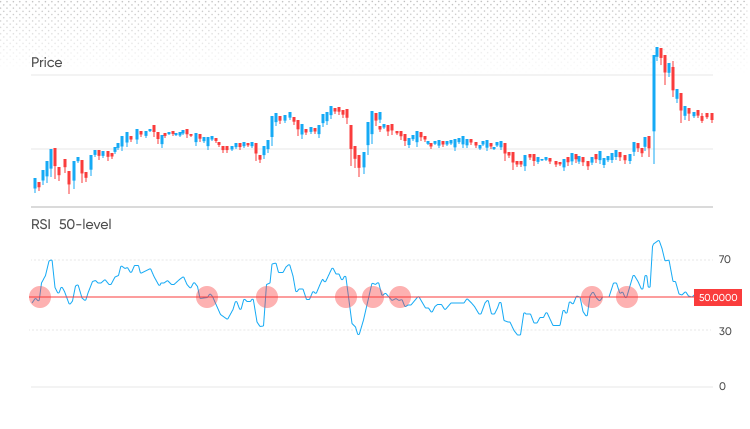
- 50-Crossover Strategy:
- In the 50-crossover strategy, traders use the RSI crossing above or below the 50 level as a signal.
- When RSI crosses above 50, it suggests that bullish momentum may be strengthening, and traders might consider buying or holding long positions.
- When RSI crosses below 50, it suggests that bearish momentum may be strengthening, and traders might consider selling or going short.
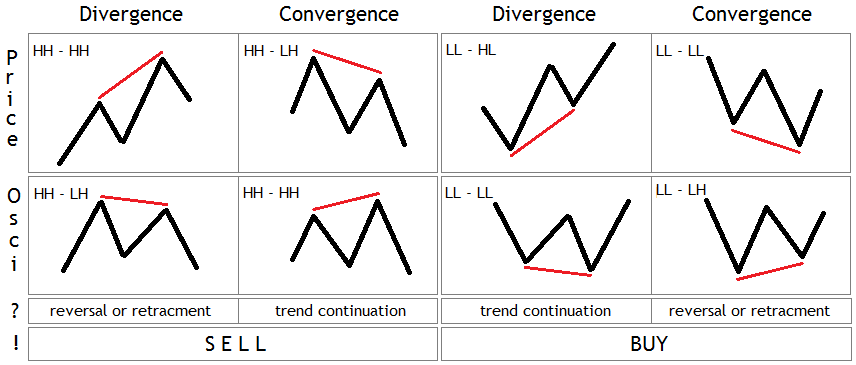
- Divergence Strategy:
- Divergence occurs when the price of an asset moves in the opposite direction of the RSI indicator. This can be a powerful signal.
- Bullish Divergence: Occurs when the price makes lower lows, but the RSI makes higher lows. It can signal a potential reversal to the upside.
- Bearish Divergence: Occurs when the price makes higher highs, but the RSI makes lower highs. It can signal a potential reversal to the downside.
- RSI Failure Swings Strategy:
- This strategy looks for specific patterns in RSI values to identify potential trend reversals.
- Bullish Failure Swing: When RSI drops below 30, rebounds above 30, falls again, but does not drop below its previous low. This can signal a potential bullish reversal.
- Bearish Failure Swing: When RSI rises above 70, pulls back below 70, rises again, but does not exceed its previous high. This can signal a potential bearish reversal.
It’s important to note that while these RSI trading strategies can be useful, they are not foolproof, and false signals can occur. Traders often use additional technical indicators, chart patterns, and fundamental analysis to confirm RSI signals and make informed trading decisions.
How to Trade Using RSI and Other Indicators?
Trading using the RSI (Relative Strength Index) and other indicators can be an effective approach, but it’s important to be aware of both the benefits and limitations of such a strategy.
1. RSI with MACD:
- RSI: RSI is a momentum oscillator that helps identify potential overbought and oversold conditions or reversals in an asset’s price. Traders commonly use RSI levels of 70 and 30 as thresholds for overbought and oversold conditions, respectively.
- MACD (Moving Average Convergence Divergence): MACD is a trend-following momentum indicator that consists of two lines, the MACD line and the signal line. Crossovers between these lines indicate potential changes in momentum.
- Strategy: Combining RSI with MACD can provide robust signals. For example, when RSI is in oversold territory (below 30) and the MACD line crosses above the signal line, it can signal a potential bullish entry point. Conversely, when RSI is overbought (above 70) and the MACD line crosses below the signal line, it can suggest a potential bearish entry.
2. RSI with MA Crossover:
- RSI: RSI helps traders gauge the strength and potential reversals in price trends.
- Moving Averages (MA): Moving averages are trend-following indicators that smooth out price data to identify trend direction.
- Strategy: This strategy combines RSI with MA crossovers for trend confirmation. For instance, if RSI is oversold, indicating a potential reversal to the upside, and the short-term MA crosses above the long-term MA, it can confirm a bullish trend. Conversely, if RSI is overbought and the short-term MA crosses below the long-term MA, it can confirm a bearish trend.
3. RSI and Price Action Trading:
- RSI: RSI helps identify potential reversal points.
- Price Action: Price action traders focus on the purest form of market data – price. They analyze candlestick patterns, support/resistance levels, and chart patterns to make trading decisions.
- Strategy: Combining RSI with price action analysis can provide powerful signals. For example, when RSI shows bullish divergence (RSI makes higher lows while price makes lower lows), and there is a bullish reversal candlestick pattern (e.g., a hammer or bullish engulfing pattern) at a significant support level, it can serve as a strong buy signal. Price action traders often use RSI as a confirmation tool alongside their other analyses.
4. RSI and Relative Vigor Index (RVI):
- RSI: RSI identifies overbought and oversold conditions and potential reversals.
- RVI (Relative Vigor Index): RVI measures the strength of a trend by comparing the opening and closing prices relative to the trading range.
- Strategy: Using RSI and RVI together can provide a comprehensive view of trend strength. For example, if RSI is overbought but RVI continues to rise, it indicates that the trend is still strong, potentially offering opportunities to stay in the trade. On the other hand, if RSI is overbought and RVI starts declining or shows divergence, it may suggest a weakening trend and a potential reversal.
5. RSI with Keltner Channel Indicator:
- RSI: RSI identifies overbought and oversold conditions.
- Keltner Channel: The Keltner Channel consists of an upper and lower channel line based on an average true range (ATR). It helps traders identify price volatility and potential breakout points.
- Strategy: Combining RSI with the Keltner Channel can be useful for volatility-based trading. For instance, when RSI is overbought, indicating potential bearish conditions, and the price touches or breaks above the upper Keltner Channel line, it can signal a potential short trade. Conversely, when RSI is oversold, and the price touches or breaks below the lower Keltner Channel line, it can signal a potential long trade.
These strategies illustrate how the RSI can be integrated with other indicators to make more informed trading decisions. However, it’s essential to remember that no trading strategy is foolproof, and risk management is critical. Traders should also consider backtesting and adapting these strategies to their specific trading styles and the assets they are trading.
How to Use RSI with additional Indicators?
Using the RSI (Relative Strength Index) in conjunction with additional technical indicators can provide a more comprehensive analysis of an asset’s price movement and increase the reliability of your trading signals. Here are several commonly used combinations of RSI with other indicators:
1. RSI and Moving Averages (MAs):
- Explanation: Moving averages smooth out price data and help identify trends. When combined with RSI, they provide trend confirmation and potential reversal signals.
- Strategy: Consider using the RSI in conjunction with moving average crossovers. For instance, when the RSI is overbought, but a short-term moving average crosses below a long-term moving average (a death cross), it may signal a potential bearish reversal. Conversely, when RSI is oversold, and a bullish crossover (a golden cross) occurs, it could signal a potential bullish reversal.
2. RSI and MACD (Moving Average Convergence Divergence):
- Explanation: MACD is a trend-following indicator that helps gauge momentum. When used with RSI, it provides both momentum and overbought/oversold signals.
- Strategy: Look for confluence between RSI and MACD signals. For instance, if RSI is overbought, but MACD shows a bearish crossover, it may indicate a high probability of a price decline. Conversely, if RSI is oversold and MACD shows a bullish crossover, it may suggest a potential price rally.
3. RSI and Bollinger Bands:
- Explanation: Bollinger Bands consist of a middle moving average and two outer bands that represent price volatility. When combined with RSI, they help identify potential reversals.
- Strategy: Watch for RSI signals coinciding with Bollinger Band touches or breaches. For instance, when RSI is overbought, and the price touches or crosses above the upper Bollinger Band, it could indicate a potential short trade. Conversely, when RSI is oversold, and the price touches or crosses below the lower Bollinger Band, it may signal a potential long trade.
4. RSI and Stochastic Oscillator:
- Explanation: The Stochastic Oscillator measures the relative position of a price’s closing price within its price range. Combined with RSI, it adds confirmation to overbought and oversold conditions.
- Strategy: Look for RSI signals that coincide with Stochastic Oscillator confirmations. For example, if RSI is overbought, and the Stochastic Oscillator confirms this by crossing below 80, it may indicate a bearish reversal. Conversely, when RSI is oversold, and the Stochastic Oscillator confirms by crossing above 20, it may suggest a bullish reversal.
5. RSI and Fibonacci Retracement Levels:
- Explanation: Fibonacci retracement levels help identify potential support and resistance areas on a price chart. Combining them with RSI can enhance your trade entries and exits.
- Strategy: Look for RSI signals that coincide with Fibonacci retracement levels. For example, if RSI indicates overbought conditions and coincides with a resistance level at a key Fibonacci retracement level (e.g., 61.8%), it may suggest a potential reversal point for a short trade.
6. RSI and Volume Analysis:
- Explanation: Trading volume represents the number of shares or contracts traded and can indicate the strength of price movements. Combining RSI with volume analysis provides insight into the conviction behind price changes.
- Strategy: When RSI shows divergence with price action, and there is a significant increase or decrease in trading volume, it can indicate a potential trend reversal or continuation. For example, if RSI is overbought, but volume is declining, it may suggest a weakening bullish trend.
7. RSI and Support/Resistance Levels:
- Explanation: Support and resistance levels represent price areas where buying or selling pressure has historically been significant. Combining them with RSI helps identify potential breakout or reversal points.
- Strategy: Watch for RSI signals coinciding with major support or resistance levels. For instance, when RSI is overbought and coincides with a strong resistance level, it may suggest a potential reversal point for a short trade.
Which Indicator Works Best With RSI?
The effectiveness of combining the RSI (Relative Strength Index) with another indicator depends on your trading goals, the assets you’re trading, and your trading style. There is no one-size-fits-all answer, as different indicators serve different purposes and may be more suitable for specific trading scenarios. However, here are some commonly used indicators that work well in combination with RSI:
Moving Averages (MA):
Moving averages, such as the Simple Moving Average (SMA) or Exponential Moving Average (EMA), work well with RSI to confirm trend direction and identify potential entry or exit points. Combining RSI with moving average crossovers can be particularly effective.
MACD (Moving Average Convergence Divergence):
MACD is a trend-following momentum indicator that complements RSI by providing insight into the strength and direction of a trend. RSI and MACD crossovers can provide powerful signals.
Bollinger Bands:
Bollinger Bands help traders identify volatility and potential reversal points. RSI can be used in conjunction with Bollinger Bands to identify overbought and oversold conditions and potential breakout or reversal points.
Stochastic Oscillator:
The Stochastic Oscillator is another momentum oscillator that can be used alongside RSI to confirm overbought and oversold conditions. Confluence between RSI and Stochastic signals can increase confidence in trading decisions.
Fibonacci Retracement Levels:
Fibonacci retracement levels help identify potential support and resistance levels. Combining RSI with Fibonacci retracement levels can enhance your trade entries and exits, particularly when trading reversals.
Volume Analysis:
Volume indicators, such as On-Balance Volume (OBV) or Volume Price Trend (VPT), can complement RSI by providing insight into the strength of price movements. Divergences between RSI and volume can signal potential trend reversals.
Relative Vigor Index (RVI):
RVI measures the strength of a trend and can be used alongside RSI to confirm trend strength or weakness. When RSI signals align with RVI signals, it can provide a more robust trading setup.
Ichimoku Cloud:
The Ichimoku Cloud is a comprehensive indicator that includes various components, including a cloud (Kumo) and lagging span. Traders often use RSI in conjunction with the Ichimoku Cloud to identify trends, support/resistance levels, and potential entry/exit points.
Momentum Oscillators (e.g., Rate of Change – ROC):
Other momentum oscillators can complement RSI by providing additional confirmation of price momentum. ROC, for example, can be used alongside RSI to confirm momentum shifts.
How To Use RSI In Day Trading or Intraday Trading?
Day traders often use the RSI (Relative Strength Index) as a valuable tool for making short-term trading decisions. RSI can provide insight into overbought and oversold conditions, trend strength, and potential reversal points during a single trading session. Here’s how day traders typically use RSI:
Identifying Overbought and Oversold Conditions:
- Day traders use RSI to spot extreme price conditions within a short timeframe. The standard RSI levels for identifying overbought and oversold conditions are usually set at 70 and 30, respectively.
- In day trading, when RSI crosses above 70, it suggests that the asset may be overbought, potentially signaling a short-selling opportunity. Conversely, when RSI drops below 30, it indicates oversold conditions, which may present a buying opportunity.
Confirming Trend Direction:
- RSI can be used to confirm the direction of the prevailing trend. Day traders often look for divergence between RSI and price action.
- Bullish Divergence: When price makes lower lows, but RSI makes higher lows, it suggests that selling pressure is waning, potentially indicating a bullish reversal.
- Bearish Divergence: When price makes higher highs, but RSI makes lower highs, it suggests that buying pressure is diminishing, potentially indicating a bearish reversal.
- Day traders may use these divergences to make contrarian trades or to confirm the trend they are trading.
Identifying Reversal Signals:
- Day traders use RSI to identify potential reversal signals within a single trading session. They may look for RSI to cross above or below the overbought or oversold levels.
- For example, if an asset’s RSI crosses below 30 and then moves back above it, it may indicate a potential bullish reversal. Conversely, if RSI crosses above 70 and then drops back below it, it may signal a potential bearish reversal.
Incorporating Short-Term RSI Periods:
- Day traders often adjust the RSI period to shorter timeframes (e.g., 9, 5, or even 3) to capture more immediate price movements. Shorter RSI periods make the indicator more sensitive to price changes, providing faster signals.
- However, using very short RSI periods can also result in more false signals, so day traders should find a balance based on their trading style and the asset they are trading.
Combining RSI with Other Indicators:
- Day traders often use RSI in combination with other technical indicators like moving averages, MACD, or volume analysis to increase the reliability of their trading signals.
- For example, they might look for RSI to cross below 30 while the 50-period moving average is sloping upward, signaling a potential long trade in an uptrend.
Setting Intraday Targets and Stop-Loss Orders:
Day traders use RSI to set intraday price targets and stop-loss orders. When RSI reaches overbought conditions, they may consider taking profits, and when it reaches oversold conditions, they may set tight stop-loss orders to limit potential losses.
Continuous Monitoring and Adaptation:
Day traders continuously monitor RSI and adapt their trading decisions based on changing conditions throughout the trading session. Flexibility and the ability to act quickly are essential in day trading.
It’s important to note that while RSI can be a valuable tool for day traders, it should not be used in isolation. Traders should consider other technical and fundamental factors, as well as practice effective risk management, to make informed trading decisions.
5 Best RSI Settings for Day Trading Strategies
The best RSI settings for day trading strategies can vary depending on your trading style, the assets you’re trading, and the volatility of the markets you’re in. Day traders often use shorter RSI settings to capture shorter-term price movements and make quicker trading decisions. Here are some common RSI settings for day trading strategies:
RSI Period:
A common RSI period for day trading is 9. This setting provides a more sensitive RSI that reacts quickly to price changes. It’s suitable for capturing short-term momentum shifts and overbought/oversold conditions within a single trading session.
Overbought and Oversold Levels:
The standard overbought level for RSI is 70, and the oversold level is 30. However, in day trading, you might consider using more extreme levels, such as 80 for overbought and 20 for oversold, to identify more significant price extremes.
Calculation Method:
RSI can be calculated using different methods, such as Simple, Exponential, or Smoothed. The default method is typically Simple. For day trading, most traders use the Simple RSI calculation method because it’s straightforward and responsive to price changes.
Divergence Confirmation:
If you plan to use RSI to identify divergences in day trading, you might want to experiment with different settings to see which works best for the specific assets you’re trading. Some traders prefer shorter RSI settings (e.g., 9) to detect divergences more quickly.
Adaptability:
Keep in mind that day traders often adjust their RSI settings based on market conditions and the assets they are trading. What works best for one asset or market condition may not work as well for another. Be prepared to adapt your RSI settings as needed.
Conclusion
Combining the RSI (Relative Strength Index) with other technical indicators can enhance your trading strategy by providing additional confirmation signals and insights into market conditions. The choice of which indicator to use alongside RSI depends on your trading goals, asset preferences, and trading style.
Remember that there is no one-size-fits-all solution, and it’s essential to conduct thorough analysis, backtesting, and adaptability to determine the best combination for your specific trading strategy. Additionally, risk management and trading discipline are fundamental to successful trading, regardless of the indicators you employ.
FAQs about RSI
1. Can RSI be used as a standalone indicator for trading?
Yes, RSI can be used as a standalone indicator for trading, especially for identifying overbought and oversold conditions, potential reversals, and trend confirmations. However, many traders prefer to use it in combination with other indicators to increase the reliability of their signals.
2. What is the ideal RSI period for swing trading?
Swing traders often use an RSI period between 14 and 21 to capture medium-term price movements. The choice of period can vary based on the trader’s preferences and the assets being traded.
3. Should RSI settings be adjusted for different timeframes?
Yes, RSI settings can be adjusted for different timeframes. Shorter RSI periods (e.g., 9 or 5) are suitable for intraday trading, while longer periods (e.g., 14 or 21) are often used for swing trading or longer-term analysis.
4. How can I avoid false signals when using RSI with other indicators?
Avoiding false signals requires careful analysis and confirmation from multiple indicators. Look for confluence between RSI signals and signals from other technical indicators, such as moving averages or MACD. Additionally, consider using filters, like price action analysis, to reduce false signals.
5. Can RSI be used for cryptocurrency trading?
Yes, RSI can be used for cryptocurrency trading, just as it is for traditional assets. Cryptocurrency markets exhibit similar price patterns and behaviors, making RSI a valuable tool for identifying trading opportunities and managing risk.
6. How do I adapt RSI settings to different market conditions?
Adapt RSI settings based on market conditions by considering factors such as asset volatility and trading volume. In highly volatile markets, you might use shorter RSI periods to capture rapid price changes, while in less volatile markets, longer periods may be more appropriate.
7. Is RSI a leading or lagging indicator?
RSI is considered a leading indicator because it provides signals that can precede price movements. It helps traders anticipate potential reversals or shifts in momentum.
8. Can RSI be used for long-term investing?
While RSI is more commonly associated with shorter-term trading strategies, it can also be used in long-term investing to identify potential entry or exit points. Long-term investors may use longer RSI periods and combine them with other fundamental analysis methods.