
Table of Contents
In the dynamic world of trading and investing, staying ahead of the curve is a constant challenge. Traders often rely on a variety of technical indicators and tools to navigate the intricate landscape of financial markets. Among these tools, the Supertrend indicator stands out as an essential instrument for market analysis. In this comprehensive guide, we will delve deeper into the Supertrend indicator, exploring its intricacies, applications, trading strategies, and addressing common questions.
What is the Supertrend Indicator?
The Supertrend indicator is a powerful technical analysis tool used by traders and investors to identify trends within the financial markets. Its primary purpose is to assist traders in determining the prevailing trend’s direction and potential entry and exit points. By doing so, it effectively filters out noise in price movements, making it easier to discern meaningful market trends.
Supertrend Indicator Formula
The calculation of the Supertrend indicator involves the use of the following formula:
- Upper Band (UB) = [(High + Low) / 2] + (Multiplier * ATR)
- Lower Band (LB) = [(High + Low) / 2] – (Multiplier * ATR)
Here, ATR (Average True Range) plays a pivotal role in measuring market volatility, an essential component in determining the indicator’s upper and lower bands.
How to Use the Supertrend Indicator?
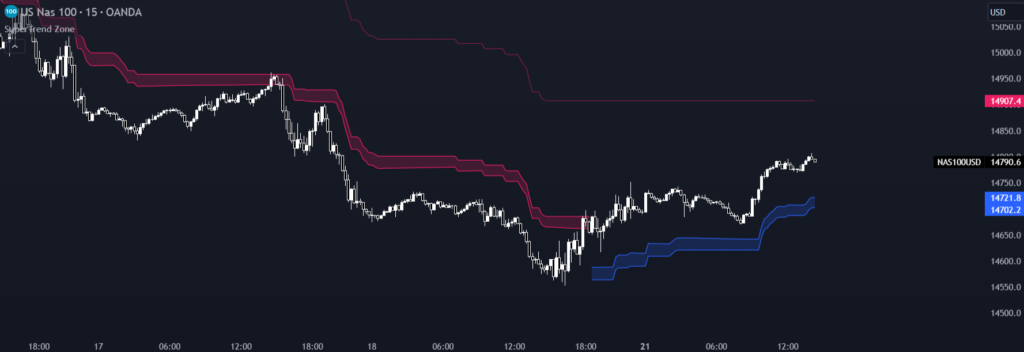
Utilizing the Supertrend indicator is a relatively straightforward process. It is represented as a line on the price chart, making it easy to interpret. When the Supertrend line is positioned below the price, it signifies a bullish (upward) trend, prompting traders to consider buying. Conversely, when the Supertrend line hovers above the price, it signals a bearish (downward) trend, indicating that traders should contemplate selling.
Using the Supertrend indicator effectively requires not only a basic understanding of its mechanics but also a nuanced approach to its application. Here, we’ll delve deeper into the nuances of utilizing this powerful tool:
- Confirming the Trend Strength: While the Supertrend indicator does an excellent job of identifying trends, it’s essential to gauge the strength of the trend it presents. Traders can use additional technical analysis tools, such as momentum oscillators like the Relative Strength Index (RSI) or Moving Average Convergence Divergence (MACD), to confirm whether the identified trend is strong or weak. Strong trends tend to provide more reliable signals.
- Fine-Tuning Parameters: The default parameters of the Supertrend indicator may not be suitable for all market conditions or trading styles. Traders should experiment with different settings, including the multiplier and period, to align the indicator with their specific preferences. For instance, in a volatile market, a higher multiplier might be appropriate to capture swift price movements, while in a stable market, a lower multiplier could be better for filtering out noise.
- Avoiding Choppy Markets: One of the limitations of the Supertrend indicator is its susceptibility to generating false signals during sideways or choppy markets. To mitigate this, traders should exercise caution and consider other indicators or market conditions before acting on Supertrend signals. Additionally, they may choose to stay out of the market when the Supertrend provides mixed or unclear signals.
- Combining with Support and Resistance Levels: Support and resistance levels play a crucial role in technical analysis. Traders can enhance the reliability of Supertrend signals by considering these levels when making trading decisions. For instance, a Supertrend buy signal aligning with a major support level can provide stronger confirmation.
- Risk Management: No trading strategy, including those involving the Supertrend indicator, is foolproof. Traders must implement effective risk management techniques, including setting stop-loss orders and determining position sizes based on their risk tolerance. This helps protect capital in case a trade goes against the expected trend.
- Continuous Monitoring: Financial markets are dynamic, and trends can change rapidly. Traders should continuously monitor their positions when using the Supertrend indicator. Regularly reviewing and adjusting stop-loss levels or taking partial profits can help lock in gains and limit losses.
- Avoid Overtrading: Overtrading is a common pitfall for traders. It’s important to exercise discipline and avoid entering trades solely based on Supertrend signals. Instead, consider a holistic approach that takes into account market conditions, news events, and broader economic factors.
- Backtesting and Analysis: Before implementing the Supertrend indicator in live trading, consider backtesting it on historical data to assess its performance and suitability for your chosen markets and timeframes. This practice can help you refine your strategy and gain confidence in the indicator’s signals.
- Continuous Learning: The world of trading is ever-evolving. Stay updated with the latest market developments, trading strategies, and enhancements to the Supertrend indicator. Continuous learning and adaptation are key to long-term success in trading.
What are the Parameters for the Supertrend Indicator?
The versatility of the Supertrend indicator is one of its standout features. Traders can customize its parameters to align with their trading preferences and styles. The two most common parameters are:
- Multiplier: This factor determines the indicator’s sensitivity to price fluctuations. A higher multiplier makes the Supertrend more responsive to recent price changes, while a lower multiplier smoothens out the indicator’s line.
- Period: The period parameter dictates the number of bars or periods used in calculating the Supertrend. Longer periods result in a smoother Supertrend line, whereas shorter periods make it more reactive to recent price movements.
Selecting the right parameters for the Supertrend indicator is a critical aspect of using it effectively in your trading strategy. Let’s explore this in greater detail to understand how you can fine-tune these parameters for optimal results:
- Multiplier Considerations: The multiplier parameter in the Supertrend indicator is a crucial factor in determining its sensitivity to price movements. A higher multiplier makes the Supertrend more responsive to recent price changes, potentially providing early signals but also increasing the likelihood of false signals. Conversely, a lower multiplier smoothens out the Supertrend line, reducing false signals but potentially causing delayed entries or exits.
- High Multiplier (e.g., 3 or 4): This setting is suitable for traders who prefer aggressive trading and are willing to accept higher risk. It may generate more signals, but some of them might be false or premature.
- Moderate Multiplier (e.g., 2 or 2.5): This is a balanced choice that provides a compromise between sensitivity and reliability. It can suit traders who seek a middle ground between aggressiveness and caution.
- Low Multiplier (e.g., 1 or 1.5): A lower multiplier setting makes the Supertrend indicator less sensitive to price fluctuations. Traders who prioritize minimizing false signals and are comfortable with a smoother, more conservative approach often prefer this setting.
- Period Selection: The period parameter in the Supertrend indicator determines the number of bars or periods used in calculating the indicator. A longer period smoothens out the Supertrend line, reducing noise, but may result in delayed signals. A shorter period makes the indicator more responsive to recent price changes but can lead to more frequent signals, some of which may be less reliable.
- Longer Period (e.g., 14 or 20): A longer period is suited for traders with a longer-term perspective, such as swing or position traders. It helps filter out short-term fluctuations, providing more stable trend signals.
- Moderate Period (e.g., 10 or 12): This setting balances responsiveness and stability, making it a common choice for various trading styles. It can be effective for swing trading and investing.
- Shorter Period (e.g., 7 or 8): Shorter periods are suitable for day traders or those seeking quick, short-term opportunities. The Supertrend line reacts swiftly to recent price changes but may generate more signals.
- Adaptation to Market Conditions: Market conditions can vary from highly volatile to range-bound or trending. Traders should consider adjusting the Supertrend’s parameters to match the current market environment. For instance, in a highly volatile market, a higher multiplier and shorter period may be more appropriate to capture swift price movements. In contrast, during a stable or sideways market, a lower multiplier and longer period may help filter out false signals.
- Regular Evaluation: Traders should not hesitate to revisit and adjust the Supertrend indicator’s parameters based on changing market conditions and evolving trading strategies. Regularly assessing the effectiveness of chosen settings through backtesting and analysis can lead to refinements that improve performance.
- Risk Management: Regardless of the parameters selected, risk management remains paramount. Setting appropriate stop-loss levels, determining position sizes based on risk tolerance, and avoiding overleveraging are essential practices to safeguard capital, irrespective of the Supertrend’s sensitivity settings.
By carefully fine-tuning the Supertrend indicator’s parameters, traders can align it with their specific trading objectives and market conditions. It’s important to remember that there is no one-size-fits-all approach, and experimentation combined with diligent analysis can lead to the discovery of optimal settings that enhance the indicator’s effectiveness in generating reliable trading signals.
How to Identify Buy and Sell Signals Using Supertrend Indicators?
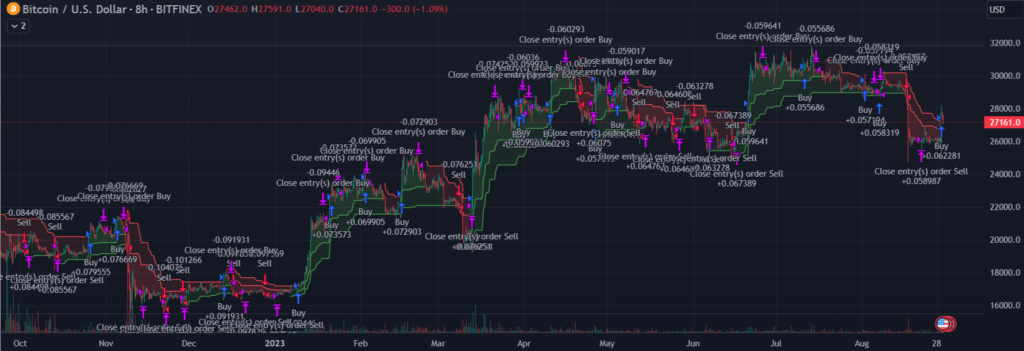
Buy and sell signals generated by the Supertrend indicator hinge on the position of its line relative to the price chart. When the Supertrend line is located below the price, it generates a buy signal, suggesting an ongoing uptrend. Conversely, when the Supertrend line resides above the price, it generates a sell signal, indicating an ongoing downtrend.
Identifying buy and sell signals accurately is the core objective when utilizing the Supertrend indicator in your trading strategy. This section explores the nuances of deciphering these signals effectively to make informed trading decisions:
- Understanding Signal Generation: As previously mentioned, the Supertrend indicator generates buy and sell signals based on the positioning of its line relative to the price chart. When the Supertrend line resides below the price chart, it signals a buy opportunity, indicating an ongoing bullish (upward) trend. Conversely, when the Supertrend line is positioned above the price chart, it generates a sell signal, indicating an ongoing bearish (downward) trend.
- Confirmation Through Candlestick Patterns: While the Supertrend indicator provides valuable insights into trend direction, traders often complement it with candlestick patterns to reinforce their buy and sell decisions. For instance, a bullish candlestick pattern, such as a hammer or bullish engulfing pattern, occurring when the Supertrend is in a buy position can add confidence to your buy signal. Conversely, a bearish candlestick pattern like a shooting star or bearish engulfing pattern can strengthen a sell signal.
- Volume Analysis: The volume of trading activity can provide critical context to Supertrend signals. Higher trading volumes during a Supertrend buy signal can signify increased buying interest, adding conviction to the bullish outlook. Conversely, a sell signal accompanied by rising trading volumes can confirm a strong bearish sentiment.
- Price Patterns: In addition to candlestick patterns, traders often incorporate classic chart patterns into their analysis. Patterns like head and shoulders, double tops, and flags can validate Supertrend signals. For example, if a Supertrend buy signal coincides with the breakout of a bullish flag pattern, it can reinforce the signal’s reliability.
- Moving Averages: Traders may also employ moving averages in conjunction with the Supertrend indicator to confirm signals. A popular approach is to use a shorter-term moving average (e.g., 10-day) and a longer-term moving average (e.g., 50-day). A Supertrend buy signal coupled with a golden cross (short-term moving average crossing above the long-term moving average) can add weight to the signal.
- Divergence Analysis: Divergence occurs when the Supertrend indicator contradicts the price movement. Bullish divergence occurs when the price makes lower lows while the Supertrend line forms higher lows, signaling a potential reversal to the upside. Bearish divergence is the opposite, indicating a potential reversal to the downside.
- Multiple Timeframe Analysis: For a more comprehensive view, traders often employ multiple timeframes when identifying Supertrend signals. For instance, they might use a longer timeframe (e.g., daily) to establish the overall trend direction and a shorter timeframe (e.g., 1-hour or 15-minute) for precise entry and exit points. Aligning signals across different timeframes can enhance the confidence in a trade.
Trading Strategy Using Supertrend and Moving Average Crossover
A popular trading strategy combines the Supertrend indicator with a moving average crossover approach. When the Supertrend line is positioned below the price, and a shorter-term moving average crosses above a longer-term moving average, a robust buy signal emerges. Conversely, when the Supertrend line is positioned above the price, and the shorter-term moving average crosses below the longer-term moving average, a compelling sell signal surfaces. This amalgamation of indicators enhances the precision of trading decisions.
Understanding the Supertrend-Moving Average Crossover Strategy:
- Supertrend as the Trend Filter: In this strategy, the Supertrend indicator acts as a trend filter. It helps traders identify the primary trend direction – bullish (uptrend) or bearish (downtrend). The Supertrend indicator, with its sensitivity to price movements, offers a dynamic perspective on the prevailing trend.
- Moving Averages as Timing Indicators: Moving averages, on the other hand, are used as timing indicators. The strategy typically involves two moving averages: a short-term MA and a long-term MA. Common choices are the 10-day and 50-day MAs. The short-term MA responds quickly to recent price changes, while the long-term MA provides a smoother, broader view of price trends.
Executing the Strategy:
1. Confirming the Primary Trend: The first step is to determine the primary trend direction using the Supertrend indicator. When the Supertrend line is below the price, it signifies a bullish trend, and when it’s above, it indicates a bearish trend.
2. Identifying Buy Signals: For buy signals, you look for a confluence of factors:
- The Supertrend indicator should be in a bullish state (below the price).
- The short-term MA (e.g., 10-day) should cross above the long-term MA (e.g., 50-day).
- This crossover should occur when both MAs are below the current price, indicating an alignment of trend confirmation.
3. Spotting Sell Signals: For sell signals, the following conditions are sought:
- The Supertrend indicator should be in a bearish state (above the price).
- The short-term MA should cross below the long-term MA.
- This crossover should occur when both MAs are above the current price, signifying a confirmation of the bearish trend.
4. Risk Management: Implement sound risk management practices by setting stop-loss and take-profit levels. These levels should be determined based on your risk tolerance and the volatility of the asset you’re trading.
Advantages of the Supertrend-Moving Average Crossover Strategy:
- Objective Trend Identification: The Supertrend indicator offers a clear and objective method for identifying the primary trend direction.
- Effective Timing: Moving average crossovers provide precise entry and exit points within the context of the identified trend.
- Reduction in False Signals: By combining two indicators, this strategy helps filter out false signals that each indicator might produce on its own.
- Versatility: The strategy can be applied to various markets and timeframes, making it adaptable to different trading styles.
Challenges and Considerations:
- Lagging Nature: Both the Supertrend and moving averages are lagging indicators, meaning they respond to past price data. As a result, they may not provide signals at the very beginning of a trend.
- False Signals in Choppy Markets: Like any technical strategy, this approach may generate false signals during sideways or range-bound market conditions. It’s essential to exercise caution and consider additional factors when market conditions are uncertain.
- Period Selection: The choice of moving average periods can impact the strategy’s performance. Traders may need to experiment to find the optimal settings for the assets they are trading.
Backtesting and Continuous Learning:
Before deploying the Supertrend-Moving Average Crossover strategy in live trading, it’s advisable to backtest it on historical data. This allows you to evaluate its performance, refine your parameters, and gain confidence in its effectiveness. Additionally, staying updated with market developments and continuously refining your approach is essential to adapt to evolving market conditions.
Best Timeframe to Use in Supertrend Indicator
The choice of timeframe for the Supertrend indicator hinges on your trading style and objectives. Short-term traders frequently gravitate toward shorter timeframes, such as 5-minute or 15-minute charts, to capture quick market movements. Conversely, long-term investors often prefer daily or weekly charts for a broader perspective. Determining the ideal timeframe requires experimentation and should align with your risk tolerance and trading strategy.
Selecting the right timeframe for the Supertrend indicator is a pivotal decision that can significantly impact your trading strategy’s effectiveness. The timeframe you choose should align with your trading goals, style, and the assets you’re trading. Here’s a detailed exploration of the best timeframes to use with the Supertrend indicator:
1. Short-Term Trading:
- Intraday Trading (1-Minute to 1-Hour): Short-term traders, such as day traders and scalpers, often opt for very short timeframes, such as 1-minute to 1-hour charts. These charts are ideal for capturing quick price movements and exploiting intraday trends. A Supertrend indicator on these timeframes can provide frequent signals, facilitating rapid decision-making.
- Swing Trading (4-Hour to Daily): Swing traders typically analyze 4-hour to daily charts. These timeframes allow traders to capture intermediate price swings within a few days to weeks. A Supertrend indicator on these timeframes can help identify trends with a broader perspective, providing fewer but more significant signals.
2. Medium-Term Trading:
- Position Trading (Daily to Weekly): Position traders aim to profit from longer-term trends that can last for weeks to months. Daily and weekly charts are commonly used for this style of trading. A Supertrend indicator on these timeframes is suitable for traders who prefer a more patient approach and are willing to hold positions for extended periods.
3. Long-Term Investing:
- Investing (Weekly to Monthly): Investors who focus on long-term portfolio growth rather than short-term trading often analyze weekly to monthly charts. The Supertrend indicator on these higher timeframes can help identify major trends and provide signals that are conducive to long-term investment decisions.
Considerations for Timeframe Selection:
- Asset Type: Different assets exhibit varying degrees of volatility and liquidity. The choice of timeframe should align with the asset you’re trading. For instance, highly liquid currency pairs may be conducive to short-term trading on lower timeframes, while less liquid stocks may be better suited for longer timeframes.
- Trading Style: Your trading style plays a crucial role in determining the best timeframe. Day traders require shorter timeframes for quick trades, while swing traders and investors benefit from longer timeframes that provide a broader perspective.
- Market Volatility: Volatile markets may require shorter timeframes to capture rapid price movements. Conversely, in stable or sideways markets, longer timeframes can help filter out noise and provide more reliable signals.
- Risk Tolerance: Consider your risk tolerance when selecting a timeframe. Shorter timeframes often come with higher volatility and the potential for more frequent signals, which can require more active monitoring.
- Time Availability: Your availability to monitor the markets is another critical factor. If you have limited time for trading, longer timeframes may be more suitable as they require less frequent attention.
Adaptability and Multiple Timeframe Analysis
Many traders use a multi-timeframe analysis approach to gain a comprehensive view of the market. This involves analyzing multiple timeframes simultaneously, starting with a higher timeframe to establish the overall trend direction and then drilling down to a lower timeframe for precise entry and exit points. This approach allows traders to balance the benefits of different timeframes and enhance their decision-making.
Pros and Cons of Supertrend Indicator
The Supertrend indicator comes with its own set of advantages and limitations. Here, we’ll take a closer look at the pros and cons of using the Supertrend indicator in your trading strategy:
Pros:
- Trend Identification: One of the primary strengths of the Supertrend indicator is its ability to identify trends effectively. It helps traders distinguish between bullish (uptrend) and bearish (downtrend) market conditions, providing valuable insights into the direction of price movements.
- Ease of Use: The Supertrend indicator is relatively easy to understand and apply, making it accessible to traders of all experience levels. Its simplicity allows even novice traders to incorporate it into their strategies with ease.
- Customization: The Supertrend indicator offers customization options, allowing traders to adjust parameters like the multiplier and period to match their trading preferences and adapt to different market conditions. This flexibility enhances its versatility.
- Versatility: The Supertrend indicator can be used across various financial markets, including stocks, commodities, forex, and cryptocurrencies. It is also suitable for multiple timeframes, accommodating a wide range of trading styles.
- Risk Mitigation: By helping traders identify trends and potential entry and exit points, the Supertrend indicator can assist in risk mitigation. It allows traders to make informed decisions and implement risk management strategies effectively.
Cons:
- Lagging Indicator: Like many technical indicators, the Supertrend is a lagging indicator, meaning it responds to past price movements rather than predicting future ones. This lag can result in delayed signals, potentially causing traders to miss out on the early stages of a trend.
- False Signals in Sideways Markets: The Supertrend indicator may generate false signals during sideways or range-bound market conditions. This can lead to unprofitable trades or whipsawing, where the indicator produces buy and sell signals in quick succession.
- Subjectivity in Parameter Selection: While the Supertrend’s customization options are a benefit, they can also introduce subjectivity. Traders may struggle to find the optimal combination of parameters for their specific trading objectives and the assets they’re trading.
- Market Sensitivity: The sensitivity of the Supertrend indicator can be both an advantage and a drawback. In highly volatile markets, it may produce frequent signals, increasing the risk of false or premature entries. Conversely, in less volatile markets, it may be slower to respond to price changes.
- Not a Standalone Solution: The Supertrend indicator is most effective when used in conjunction with other technical analysis tools and factors. Relying solely on the Supertrend can lead to suboptimal trading decisions. Combining it with other indicators, such as moving averages or volume analysis, can enhance its accuracy.
- Backtesting Required: To optimize the Supertrend indicator’s performance and parameter settings, traders often need to invest time in backtesting on historical data. This process can be time-consuming and may require a substantial amount of data.
Conclusion
In summary, the Supertrend indicator is a versatile tool for traders, offering a clear and adaptable means of identifying trends and guiding entry and exit decisions. While it has strengths in its simplicity and adaptability, traders should also be aware of its limitations, such as lag and false signals. By using it in conjunction with other tools and practicing disciplined risk management, traders can harness its power to enhance their trading strategies and make more informed choices in dynamic financial markets.
FAQs about Supertrend Indicator
Here are some frequently asked questions and their answers to help you better understand the Supertrend indicator:
1. How accurate is the Supertrend strategy?
The accuracy of the Supertrend strategy depends on several factors, including market conditions, asset volatility, and the parameters used. While the Supertrend is a reliable tool for identifying trends, it is not immune to false signals, especially during choppy or sideways markets. Traders often use additional indicators and confirmatory factors to enhance the accuracy of their trading decisions.
2. How is the Supertrend indicator calculated?
The Supertrend indicator is calculated using the following formula:
Upper Band (UB) = [(High + Low) / 2] + (Multiplier * Average True Range)
Lower Band (LB) = [(High + Low) / 2] – (Multiplier * Average True Range)
Here, the Average True Range (ATR) plays a crucial role in measuring market volatility, which affects the width of the Supertrend bands.
3. How can I use the Supertrend indicator for intraday trading?
Intraday traders can adapt the Supertrend indicator by selecting shorter timeframes (e.g., 5-minute or 15-minute charts) and adjusting the parameters to suit their trading style. Vigilant monitoring and quick decision-making are crucial for intraday trading success with the Supertrend.
4. What timeframe and setting is best for the Supertrend indicator for day trading?
The best timeframe and setting for day trading with the Supertrend indicator depend on your preferences and the asset being traded. Common choices include using a 5-minute or 15-minute chart with parameters that match the market’s volatility.
5. In the stock market, is the Supertrend indicator 7,3 equal to a moving average?
No, the Supertrend indicator with a 7,3 setting is not equivalent to a simple moving average. The Supertrend uses a different calculation method based on the Average True Range (ATR) and a multiplier to determine trend direction, whereas moving averages rely solely on historical price data.