
Table of Contents
The TTM Squeeze indicator, developed by John Carter, has gained popularity for its ability to signal potential explosive moves in the market. In this article, we’ll delve into the TTM Squeeze, explaining what it is, how it works, and how traders can utilize it to enhance their trading strategies.
What is the TTM Squeeze?
The TTM Squeeze, short for “Tightening of the Bollinger Bands and Keltner Channels,” is a technical indicator used in stock trading and other financial markets. It serves as a valuable tool for identifying periods of low volatility and potential price breakouts. The key feature of the TTM Squeeze is its ability to visualize when the market is in a “squeeze” state, much like a coiled spring, where price movements are expected to be explosive.
This indicator combines elements of Bollinger Bands and Keltner Channels, two well-known volatility indicators:
- Bollinger Bands: These bands consist of a middle line (typically a 20-period moving average) and two outer bands, positioned at a certain standard deviation from the middle line. They expand and contract based on market volatility.
- Keltner Channels: These channels include an exponential moving average (EMA) of price and two bands based on an Average True Range (ATR) multiplier. They also expand and contract, providing a different perspective on volatility.
The TTM Squeeze Indicator generates visual cues on a price chart:
- Green Dots: These dots appear when the Bollinger Bands move inside the Keltner Channels, indicating a period of low volatility or consolidation. Traders interpret this as the market coiling for a potential price move.
- Red Dots: When the Bollinger Bands break out of the Keltner Channels, these dots disappear, signaling the end of the squeeze. This suggests that a significant price movement, either up or down, may be imminent.
Traders often use the TTM Squeeze to time their trades, entering positions when the squeeze is released, and implementing risk management strategies to protect against false signals.
Understanding the TTM Squeeze Components
1. Bollinger Bands: The Bollinger Bands, developed by John Bollinger, consist of three lines on a price chart:
- The middle line is the Simple Moving Average (SMA) of the price data, typically calculated using a 20-period setting.
- The upper band is calculated by adding two times the standard deviation of the price to the SMA.
- The lower band is calculated by subtracting two times the standard deviation of the price from the SMA. The width between the upper and lower bands fluctuates with market volatility. In periods of low volatility, the bands contract, and in high volatility periods, they expand.
2. Keltner Channels: The Keltner Channels, named after Chester Keltner, also consist of three lines:
- The middle line is typically a 20-period Exponential Moving Average (EMA) of the price.
- The upper channel is derived by adding two times the Average True Range (ATR) to the EMA.
- The lower channel is calculated by subtracting two times the ATR from the EMA. Like the Bollinger Bands, the Keltner Channels create a channel around the price, but they use ATR to measure volatility instead of standard deviation.
Identifying a TTM Squeeze
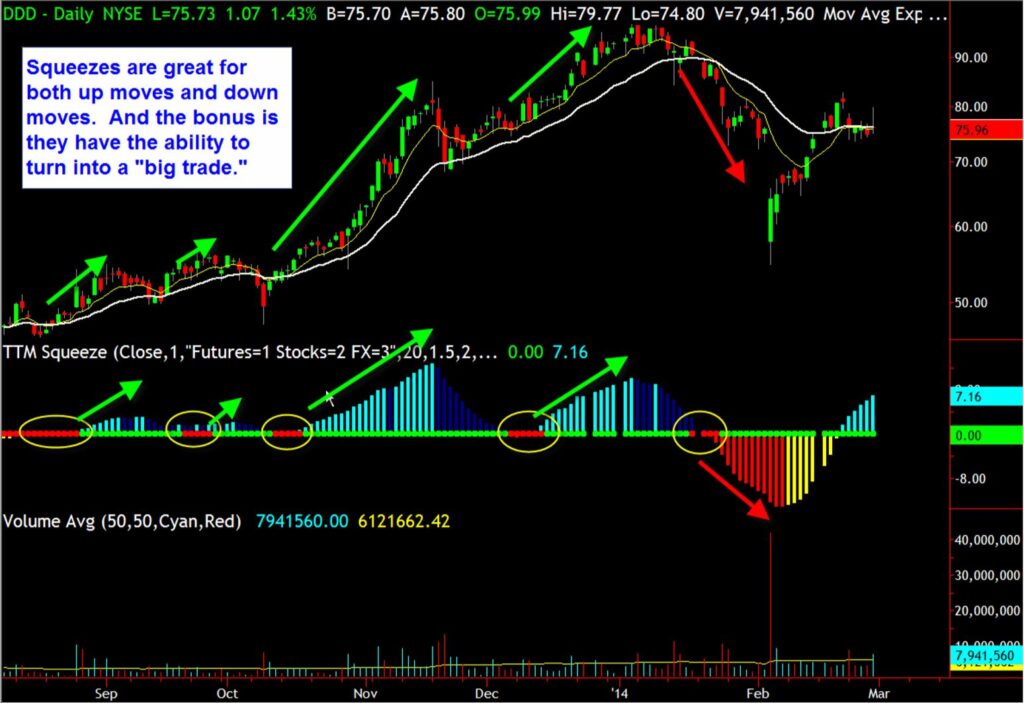
A TTM Squeeze occurs when the Bollinger Bands move within the Keltner Channels, causing them to converge. This narrowing of the bands indicates a period of reduced price volatility and potential pent-up energy in the market. Traders often describe this phase as the market “coiling” or “squeezing” like a spring, preparing for a significant price movement.
The Squeeze Release
The most critical aspect of the TTM Squeeze is the “squeeze release.” This happens when the Bollinger Bands expand and break out of the Keltner Channels. This breakout signals the end of the low-volatility phase and the beginning of a potentially substantial price move.
Traders usually pay close attention to the direction of the breakout:
- Bullish Breakout: Occurs when the price moves above the upper Keltner Channel, suggesting a potential uptrend or bullish momentum.
- Bearish Breakout: Occurs when the price moves below the lower Keltner Channel, indicating a potential downtrend or bearish momentum.
Calculating the TTM Squeeze
The TTM Squeeze indicator doesn’t involve complex mathematical calculations. Instead, it combines two existing technical indicators: Bollinger Bands and Keltner Channels, and then visually presents the information in a way that traders can interpret. The TTM Squeeze occurs when the Bollinger Bands move inside the Keltner Channels, creating a “squeeze” effect. Here’s how to calculate and interpret it:
- Calculate the Bollinger Bands and Keltner Channels as described above.
- The squeeze condition is met when the Bollinger Bands (volatility bands) move within the Keltner Channels (volatility channels), causing them to converge. This narrowing of the bands indicates a period of reduced price volatility and potential pent-up energy in the market.
- The TTM Squeeze signal suggests that the market is coiling or squeezing like a spring, preparing for a significant price movement.
- The TTM Squeeze is considered to have “released” when the Bollinger Bands expand and break out of the Keltner Channels. This breakout can be in either direction – bullish or bearish.
- Traders often pay close attention to the direction of the breakout:
- A bullish breakout occurs when the price moves above the upper Keltner Channel.
- A bearish breakout occurs when the price moves below the lower Keltner Channel.
The TTM Squeeze doesn’t provide specific numerical values or mathematical calculations but rather visually represents the state of market volatility and the potential for a price breakout.
It’s important to note that traders usually combine the TTM Squeeze with other technical indicators and tools to make more informed trading decisions. Additionally, the parameters for the moving averages, ATR, and other settings can be adjusted based on individual preferences and the specific assets being traded.
How to Use the TTM Squeeze Indicator?
Using the TTM Squeeze involves a systematic approach to identify potential trading opportunities based on the indicator’s signals of low volatility and potential breakouts. Here’s a step-by-step guide on how to use the TTM Squeeze:
1. Set Up Your Trading Platform:
- Choose a trading platform or charting software that supports the TTM Squeeze indicator. Popular platforms like Thinkorswim, TradeStation, and TradingView typically offer this indicator.
2. Add the TTM Squeeze Indicator to Your Chart:
- Open the price chart of the financial instrument you want to analyze.
- Locate and add the TTM Squeeze indicator to your chart. It will often be listed under technical indicators or studies.
3. Configure the TTM Squeeze Parameters:
- Customize the settings of the TTM Squeeze indicator according to your preferences:
- Choose the timeframe (e.g., daily, weekly, or intraday) you want to analyze.
- Set the parameters for the Bollinger Bands and Keltner Channels, such as the number of periods and standard deviation or ATR settings.
4. Interpret the TTM Squeeze Signals:
- The TTM Squeeze indicator will display colored dots (commonly green and red) on your chart. These dots represent the state of market volatility:
- A Green Dot (Squeeze On) indicates that the Bollinger Bands have moved inside the Keltner Channels, signifying a period of low volatility or market consolidation.
- A Red Dot (Squeeze Off) indicates that the Bollinger Bands have expanded and broken out of the Keltner Channels, suggesting a potential breakout in price.
5. Identify Squeeze Releases:
- A “squeeze release” occurs when the market transitions from a period of low volatility (Squeeze On) to a potential breakout (Squeeze Off). These releases can be either bullish (upward breakout) or bearish (downward breakout) based on the direction of the price movement.
6. Confirm TTM Squeeze Signals:
- To increase the reliability of TTM Squeeze signals, consider using additional technical indicators or chart patterns for confirmation. Popular confirmation indicators include the Relative Strength Index (RSI), Moving Average Convergence Divergence (MACD), or Stochastic Oscillator.
7. Plan Your Trade:
- When a squeeze release occurs and you have confirmed the signal, plan your trade accordingly:
- Long Trade (Buy): If the TTM Squeeze signals a bullish breakout, consider entering a long position.
- Short Trade (Sell): If the TTM Squeeze signals a bearish breakout, consider entering a short position.
8. Implement Risk Management:
- Set stop-loss orders to limit potential losses if the trade goes against you.
- Determine take-profit levels to secure profits if the trade moves in your favor.
- Calculate your position size based on your risk tolerance and trade setup.
9. Monitor and Manage Your Trade:
- Continuously monitor the progress of your trade and adjust your stops and targets as necessary.
- Be prepared to exit the trade if the TTM Squeeze signal changes or if market conditions shift.
10. Practice and Learn:
- Use the TTM Squeeze in a demo or paper trading environment to gain experience and refine your trading strategies.
- Continuously educate yourself about market dynamics, technical analysis, and trading psychology to improve your skills.
Interpreting TTM Squeeze
Interpreting the TTM Squeeze involves understanding the visual signals it provides on a price chart. The TTM Squeeze indicator combines the concepts of Bollinger Bands and Keltner Channels to help traders identify periods of low volatility and anticipate potential price breakouts. Here’s how to interpret the TTM Squeeze:
- Squeeze Condition (Colored Dots): The TTM Squeeze indicator often includes colored dots on the price chart. These dots signal the presence of a “squeeze.” A colored dot (often green) typically appears when the Bollinger Bands move inside the Keltner Channels. This indicates that the market is in a period of low volatility and is coiling, much like a spring getting compressed.
- Squeeze Release: The TTM Squeeze suggests that a period of low volatility is followed by a potential explosive price movement. A “squeeze release” occurs when the Bollinger Bands expand and break out of the Keltner Channels. This breakout can be either bullish (upward) or bearish (downward) depending on the direction of the price movement.
- Directional Bias: While the TTM Squeeze signals that a significant price move is likely, it doesn’t specify the direction of the breakout. Traders often use additional technical indicators or chart patterns to assess the potential direction. For example, they might look at the direction of the 20-period Simple Moving Average (SMA) or other trend-following indicators.
- Confirmation Indicators: To increase the reliability of TTM Squeeze signals, traders often use confirmation indicators such as Relative Strength Index (RSI), Moving Average Convergence Divergence (MACD), or Stochastic Oscillator. These indicators can help confirm the strength and direction of the anticipated breakout.
- Entry and Exit Points: Traders typically use the TTM Squeeze to identify potential entry and exit points for trades. They might enter a trade in the direction of the breakout when the squeeze is released. Stop-loss orders and take-profit levels are commonly used to manage risk and secure profits.
- Risk Management: It’s crucial to implement proper risk management techniques when trading based on the TTM Squeeze. Volatile breakouts can result in significant gains, but they can also lead to substantial losses if not managed carefully.
- Timeframe Considerations: The effectiveness of the TTM Squeeze can vary depending on the timeframe of the chart being analyzed. Traders often adjust their strategies and timeframes based on their trading goals, whether they are day traders, swing traders, or longer-term investors.
- Market Sentiment: Always be aware of broader market sentiment, economic events, and news releases that could influence the outcome of a TTM Squeeze breakout. External factors can impact the success of your trades.
In summary, interpreting the TTM Squeeze involves recognizing periods of low volatility (the squeeze) and being prepared for potential explosive price movements (the squeeze release).
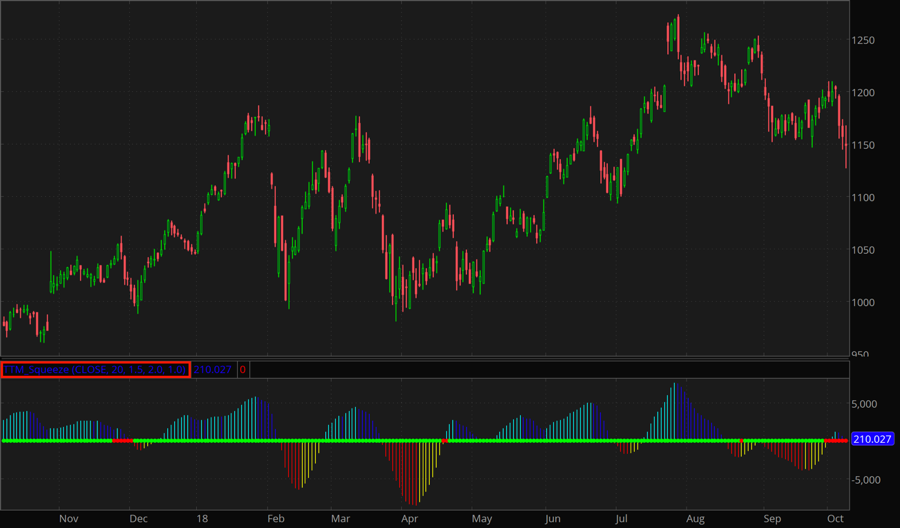
Charting With TTM Squeeze
Charting with the TTM Squeeze Indicator involves using this technical analysis tool to identify potential trading opportunities and make informed decisions based on the signals it provides. To effectively chart with the TTM Squeeze Indicator, follow these steps:
1. Select a Trading Platform:
Ensure that your chosen trading platform or charting software supports the TTM Squeeze Indicator. Most reputable platforms offer this indicator as a built-in or downloadable tool.
2. Add the TTM Squeeze Indicator to Your Chart:
- Open the price chart of the financial instrument you want to analyze.
- Find the TTM Squeeze Indicator in the indicator or studies menu.
- Add the TTM Squeeze to your chart, and configure any settings, such as timeframes and colors, as needed.
3. Understanding TTM Squeeze Signals:
- Look for colored dots on your chart. These dots indicate the presence of a squeeze condition.
- A colored dot (often green) usually appears when the Bollinger Bands are within the Keltner Channels. This signifies a period of low volatility.
- Absence of colored dots suggests that there is no current squeeze condition.
4. Identify Squeeze Releases:
- A “squeeze release” occurs when the Bollinger Bands expand and break out of the Keltner Channels.
- Squeeze releases can be either bullish (upward breakout) or bearish (downward breakout) based on the direction of the price movement.
5. Confirm Squeeze Signals:
- To increase confidence in the TTM Squeeze signals, consider using additional technical indicators or chart patterns.
- Popular confirmation indicators include the Relative Strength Index (RSI), Moving Average Convergence Divergence (MACD), or Stochastic Oscillator.
6. Trade Entry and Exit Points:
- When a squeeze is released, traders often look to enter positions in the direction of the breakout.
- Set stop-loss orders to manage risk and take-profit levels to secure profits.
- Use sound risk management principles to protect your trading capital.
7. Multiple Timeframes:
- Analyze different timeframes to confirm signals. Longer timeframes can provide broader context, while shorter timeframes can help with precise entry and exit timing.
8. Backtesting and Practice:
- Before trading with real capital, consider backtesting your strategy using historical data to evaluate the effectiveness of the TTM Squeeze in different market conditions.
Remember that while the TTM Squeeze Indicator can provide valuable insights, no indicator is foolproof. It’s essential to use it in conjunction with other analysis techniques and practice proper risk management to make informed and successful trading decisions.
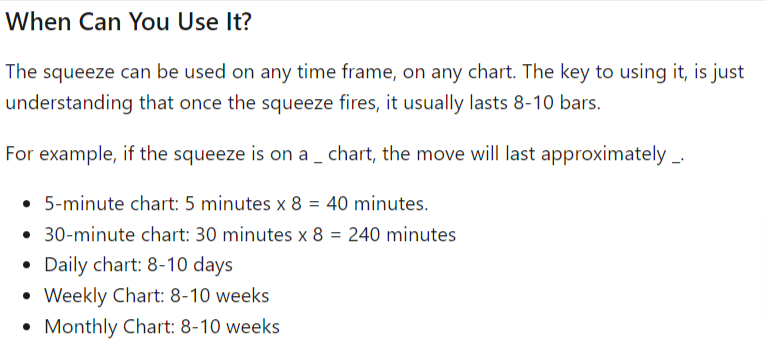
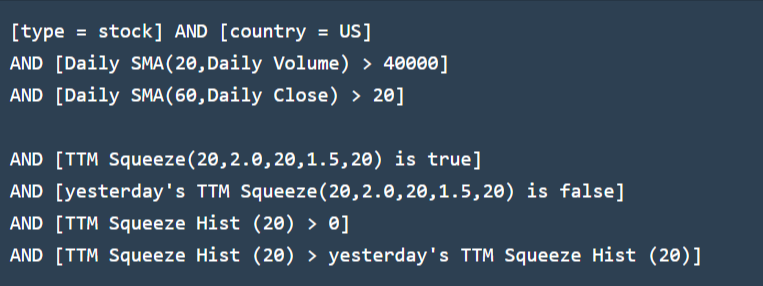
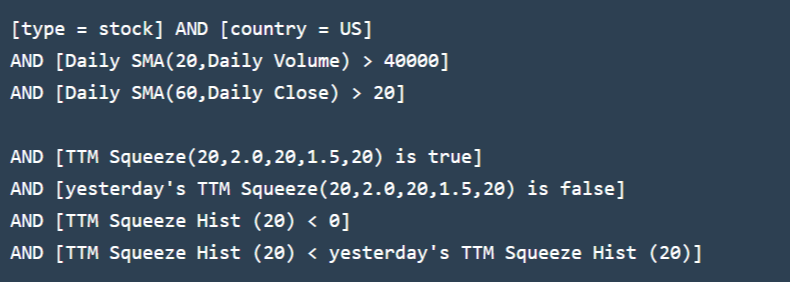
Scanning TTM Squeeze
Scanning for TTM Squeeze opportunities involves using stock screening or scanning tools to identify potential trading candidates that meet specific criteria related to the TTM Squeeze indicator. Here’s a step-by-step guide on how to scan for TTM Squeeze opportunities:
1. Select a Trading Platform or Scanner:
- Choose a trading platform or scanner that supports custom screening based on technical indicators, including the TTM Squeeze. Many popular trading platforms offer customizable scanning tools, such as Thinkorswim, TradeStation, or TradingView.
2. Access the Stock Screener:
- Locate the stock screener or scanner tool within your trading platform. It may be in a separate tab or menu.
3. Define Your Scanning Criteria:
- Set up your screening criteria based on the TTM Squeeze indicator. Here are the key criteria to consider:
- Look for stocks or financial instruments that have TTM Squeeze signals currently “on” (indicating a squeeze condition).
- Specify additional criteria such as market sector, price range, volume, or average daily trading volume to narrow down your search.
- Consider using technical confirmation indicators like the Relative Strength Index (RSI) or Moving Average Convergence Divergence (MACD) to filter results further.
4. Configure the TTM Squeeze Parameters:
- Define the TTM Squeeze parameters, including the timeframe (e.g., daily, weekly, or intraday) and settings for the Bollinger Bands and Keltner Channels (e.g., standard deviation or ATR settings).
- Ensure the scanner is set to identify when the TTM Squeeze condition is “on” and ignore when it’s “off.”
5. Run the Scan:
- Execute the scan to search for securities that meet your specified criteria.
- The scanner will generate a list of stocks or instruments that currently exhibit a TTM Squeeze condition, based on your settings.
- Review the Results:
- Examine the list of scan results to identify potential trading candidates.
- Verify that the stocks meet your additional criteria, such as liquidity, trading volume, and overall market conditions.
6. Chart Analysis and Confirmation:
- After identifying potential candidates, perform chart analysis on each to confirm the TTM Squeeze signal.
- Look for the presence of colored dots (e.g., green for a squeeze “on”) on the price chart.
- Analyze other technical indicators or patterns to confirm the potential trade.
How can I scan for TTM Squeeze opportunities on a specific trading platform?
Scanning for TTM Squeeze opportunities on a specific trading platform typically involves using the platform’s built-in scanning or screening tools. The exact process may vary from one platform to another, but here are general steps to help you scan for TTM Squeeze opportunities:
Note: This guide assumes you have access to a trading platform or charting software that supports custom scans and includes the TTM Squeeze indicator. Some platforms may require you to install or enable this indicator separately.
1. Open Your Trading Platform:
- Log in to your trading platform with your account credentials.
2. Access the Scanner or Screener:
- Locate the scanner or screener tool within the trading platform. It is often found in a separate tab or menu, labeled as “Scanner,” “Screener,” or “Stock Screener.”
3. Create a New Scan:
- Initiate a new scan by clicking on a “New Scan” or “Create New Scan” button or option.
4. Define Scan Criteria:
- Set up your scanning criteria to identify TTM Squeeze opportunities. Here’s how to specify the TTM Squeeze condition:
- Look for an option related to “TTM Squeeze” or “Volatility Squeeze” in the scan criteria.
- Configure the TTM Squeeze parameters, such as the timeframe (e.g., daily, weekly) and specific settings for the Bollinger Bands and Keltner Channels.
- Define additional criteria, if needed, to filter results based on your trading preferences. This may include price range, market sector, average daily volume, or other technical indicators.
5. Run the Scan:
- Execute the scan by clicking a “Run Scan” or similar button. The platform will search for securities that meet your specified criteria, including the TTM Squeeze condition.
6. Review Scan Results:
- The platform will generate a list of securities that match your scan criteria. Look for those that currently exhibit a TTM Squeeze condition.
7. Chart Analysis and Confirmation:
- For each potential TTM Squeeze opportunity, access the price chart and confirm the presence of TTM Squeeze signals, such as colored dots (green or red) on the chart.
- Additionally, use other technical indicators or analysis tools to confirm the trade setup before making trading decisions.
8. Plan Your Trade:
- If you identify a valid TTM Squeeze opportunity and confirm it with other indicators, plan your trade accordingly:
- Determine whether it’s a long (buy) or short (sell) trade based on the TTM Squeeze signal direction.
- Set up entry, stop-loss, and take-profit levels.
9. Implement Risk Management:
- Before executing the trade, establish proper risk management measures, including setting stop-loss orders and calculating your position size.
10. Monitor and Manage Your Trades:
- Continuously monitor your trades and adjust stops and targets as necessary.
- Be prepared to exit the trade if the TTM Squeeze signal changes or market conditions shift.
The specific steps and options for scanning may vary between trading platforms, so it’s essential to consult your platform’s documentation or support resources for platform-specific guidance on using the scanner for TTM Squeeze opportunities.
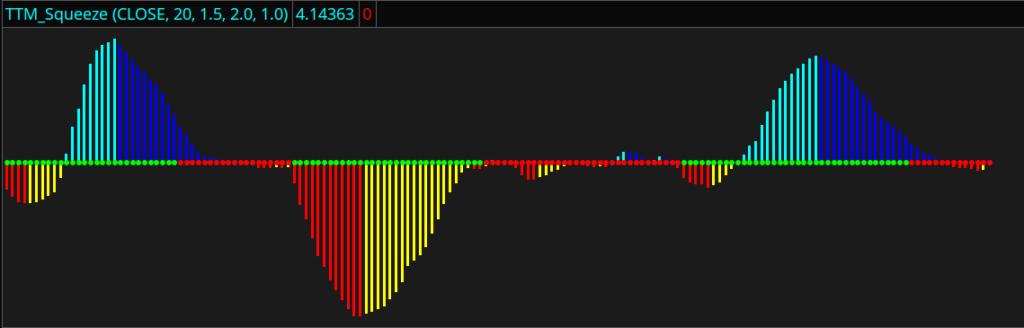
Squeeze On and Off Dots
The “Squeeze On/Off Dots” are a visual feature associated with the TTM Squeeze indicator. These dots serve as a graphical representation to help traders quickly identify whether the market is currently in a squeeze condition or not.
Here’s how the Squeeze On/Off Dots work:
- Squeeze On (Colored Dot): When the Bollinger Bands (volatility bands) move inside the Keltner Channels (volatility channels), indicating a period of low volatility and potential pent-up energy, a colored dot (often green) is displayed on the chart. This colored dot signals that the TTM Squeeze is “on,” suggesting that the market is in a state of compression, similar to a coiled spring.
- Squeeze Off (Colored Dot Absent): Conversely, when the Bollinger Bands expand and break out of the Keltner Channels, indicating a potential price movement or volatility expansion, the colored dot disappears. This signifies that the TTM Squeeze is “off,” indicating that the period of low volatility has ended, and the market may be in a state of increased activity.
These colored dots make it visually clear to traders when a TTM Squeeze condition is present or when it has been released. Traders can use this information to make timely decisions, such as entering or exiting trades based on their trading strategies and market analysis.
It’s worth noting that the color and style of the dots may vary depending on the trading platform or charting software being used, so traders should consult their specific platform’s documentation for precise details on how the Squeeze On/Off Dots are displayed and configured.
Momentum Histogram
The Momentum Histogram is a technical indicator used in financial analysis and trading to visualize and assess the strength and direction of price momentum in a given financial instrument, such as a stock, currency pair, or commodity. It is derived from a more commonly known indicator called the Moving Average Convergence Divergence (MACD).
Here’s how the Momentum Histogram works:
- Calculate the MACD Line: The MACD Line is computed by subtracting the 26-period Exponential Moving Average (EMA) from the 12-period EMA. The result is a single line that represents the short-term trend momentum.
- Calculate the Signal Line: The Signal Line is a 9-period EMA of the MACD Line. It acts as a smoothing mechanism for the MACD Line and provides a more stable signal.
- Calculate the MACD Histogram: The MACD Histogram is the difference between the MACD Line and the Signal Line. It is represented as vertical bars or histogram bars on a chart. Each histogram bar represents the difference between the MACD Line and the Signal Line at a particular point in time.
The Momentum Histogram provides several key insights:
- Bullish Momentum: When the histogram bars are above the zero line and increasing in height, it indicates bullish momentum. This suggests that the short-term trend is strengthening, and it may be a potential buying opportunity.
- Bearish Momentum: When the histogram bars are below the zero line and decreasing in height, it indicates bearish momentum. This suggests that the short-term trend is weakening, and it may be a potential selling opportunity.
- Divergence: Divergence between the histogram and the price chart can provide valuable signals. For example, if the price of an asset is making higher highs while the histogram is making lower highs (or vice versa), it may indicate a potential trend reversal.
- Crossovers: When the MACD Line crosses above the Signal Line, it generates a bullish crossover, suggesting a potential uptrend. Conversely, when the MACD Line crosses below the Signal Line, it generates a bearish crossover, indicating a potential downtrend.
Traders often use the Momentum Histogram in conjunction with other technical indicators and chart patterns to make more informed trading decisions. It can be a valuable tool for identifying potential entry and exit points in the market and gauging the overall strength and direction of price trends.
TTM Squeeze Signal to Go Long and Go Short
The TTM Squeeze indicator provides signals that can help traders make decisions on when to go long (buy) or go short (sell) in the market. The signals are based on the indicator’s assessment of market volatility and potential price breakouts. Here’s how to interpret TTM Squeeze signals for both long and short trades:
1. Going Long (Buy Signal):
- A Bullish Squeeze Release occurs when the Bollinger Bands expand and break out of the Keltner Channels to the upside.
- This breakout suggests that a period of low volatility has ended, and there’s potential for an upward price movement.
2. Confirmation for Going Long:
To increase confidence in a long trade, traders often look for additional confirmation:
- Bullish Candlestick Patterns: Look for bullish candlestick patterns like engulfing patterns, hammers, or bullish engulfing patterns near the breakout point.
- Relative Strength Index (RSI): Confirm that the RSI is rising or is in the bullish territory (above 50).
- Volume Confirmation: Ensure that trading volume is increasing or is above the average for the asset.
3. Going Short (Sell Signal):
- A Bearish Squeeze Release occurs when the Bollinger Bands expand and break out of the Keltner Channels to the downside.
- This breakout suggests that a period of low volatility has ended, and there’s potential for a downward price movement.
4. Confirmation for Going Short:
To increase confidence in a short trade, traders often look for additional confirmation:
- Bearish Candlestick Patterns: Look for bearish candlestick patterns like shooting stars, bearish engulfing patterns, or gravestone dojis near the breakout point.
- Relative Strength Index (RSI): Confirm that the RSI is falling or is in the bearish territory (below 50).
- Volume Confirmation: Ensure that trading volume is increasing or is above the average for the asset.
5. Risk Management:
Regardless of the direction (long or short) you choose based on the TTM Squeeze signal, proper risk management is essential:
- Set Stop-Loss Orders: Define a stop-loss level to limit potential losses in case the trade goes against you.
- Establish Take-Profit Levels: Determine where you plan to take profits if the trade moves in your favor.
- Consider your Position Size: Calculate the appropriate position size based on your risk tolerance and the distance to your stop-loss.
It’s important to note that while the TTM Squeeze is a useful tool for identifying potential trade setups, it’s not infallible, and false signals can occur. Therefore, traders often use additional technical analysis and indicators to confirm their decisions.
6 TTM Squeeze Strategy
- Multiple Timeframes: Consider using multiple timeframes to confirm signals. For instance, if a squeeze release occurs on a daily chart, you can look at shorter timeframes like the 1-hour or 15-minute charts for entry and exit points.
- Volume Confirmation: Incorporate volume analysis to confirm the strength of the breakout. A surge in trading volume during a squeeze release can add validity to the signal.
- Risk-Reward Ratio: Calculate and evaluate the potential risk and reward for each trade. Ensuring a favorable risk-reward ratio is crucial to long-term success.
- Market Context: Always consider the broader market context. Check for support and resistance levels, trendlines, and overall market sentiment. These factors can help you determine whether a TTM Squeeze signal aligns with the larger market picture.
- Practice Patience: Not every TTM Squeeze leads to a significant price move. Be patient and wait for clear and strong signals before entering a trade.
- Continuous Learning: Keep refining your understanding of the TTM Squeeze and adapt your strategies as market conditions evolve. Attend webinars, read books, and follow experts who specialize in this indicator.
TTM Squeeze Indicator vs. Other technical Indicators
The TTM Squeeze Indicator is a unique technical analysis tool that focuses on identifying periods of low volatility and potential price breakouts. While it has its strengths, it’s important to compare it to other popular technical indicators to understand its advantages and limitations in comparison.
Here’s a comparison between the TTM Squeeze Indicator and some popular technical indicators:
1. TTM Squeeze Indicator:
- Strengths:
- Identifies periods of low volatility, which can lead to explosive price movements.
- Provides visual signals (colored dots) that are easy to interpret.
- Suitable for both trend-following and range-bound market conditions.
- Limitations:
- May generate false signals during choppy or sideways markets.
- Doesn’t provide specific price targets or stop-loss levels.
- Requires confirmation from other indicators for trade decisions.
- Strengths:
- Smooths price data to reveal underlying trends.
- Helps identify support and resistance levels.
- Various types (Simple, Exponential, etc.) allow customization.
- Limitations:
- Lagging indicator; may not provide timely signals for fast-moving markets.
- Can result in false signals during strong trends.
3. Relative Strength Index (RSI):
- Strengths:
- Measures overbought and oversold conditions.
- Helps identify potential trend reversals.
- Divergences between RSI and price can signal potential shifts.
- Limitations:
- May stay in overbought or oversold zones for extended periods during strong trends.
- Doesn’t provide information about price direction, only momentum.
4. Moving Average Convergence Divergence (MACD):
- Strengths:
- Combines short-term and long-term moving averages to identify trends.
- Generates signals through crossovers (MACD Line and Signal Line).
- Can be used for trend confirmation.
- Limitations:
- Lagging indicator; crossover signals may occur late.
- Can generate false signals during choppy markets.
5. Bollinger Bands:
- Strengths:
- Visualizes price volatility and potential support/resistance levels.
- Can help identify overbought and oversold conditions.
- Limitations:
- Doesn’t explicitly indicate the timing of potential breakouts.
- May not work well in strongly trending markets.
6. Stochastic Oscillator:
- Strengths:
- Measures momentum and overbought/oversold conditions.
- Can be used for divergence analysis.
- Useful in ranging markets.
- Limitations:
- Generates false signals in trending markets.
- Requires additional indicators for trend confirmation.
In summary, the TTM Squeeze Indicator is unique in its focus on volatility compression and breakout potential. While it can provide valuable signals, especially in choppy markets, it is often used in conjunction with other indicators to confirm trading decisions.
Conclusion
The TTM Squeeze Indicator is a valuable tool for traders seeking to identify potential trading opportunities based on periods of low volatility and impending price breakouts. When used in conjunction with other technical analysis tools and proper risk management, the TTM Squeeze can enhance decision-making and improve the chances of successful trading outcomes.
Remember that while the TTM Squeeze can be a powerful indicator, it is not infallible, and traders should always conduct thorough analysis and stay informed about market conditions.
FAQs about TTM Squeeze
1. Can the TTM Squeeze Indicator be used for day trading?
Yes, the TTM Squeeze Indicator can be used for day trading, but it’s essential to adapt its settings and timeframes to match the intraday trading style. Traders often use shorter timeframes, such as 5-minute or 15-minute charts, for day trading.
2. What should I do when the TTM Squeeze generates conflicting signals with other indicators?
When the TTM Squeeze generates conflicting signals with other indicators, exercise caution and consider the overall context. Evaluate which indicator has stronger supporting evidence and whether market conditions align with your trading strategy.
3. Is the TTM Squeeze suitable for all financial markets, including stocks, forex, and cryptocurrencies?
Yes, the TTM Squeeze can be applied to various financial markets, including stocks, forex currency pairs, cryptocurrencies, commodities, and more. However, it’s essential to adjust the indicator settings and timeframes based on the specific market’s characteristics.
4. Can I use the TTM Squeeze as a standalone indicator for trading decisions?
While the TTM Squeeze can provide valuable signals, it is often used in conjunction with other technical indicators and analysis methods. Combining it with confirmation indicators and thorough chart analysis can enhance its effectiveness.
5. Are there variations of the TTM Squeeze indicator available?
Yes, some trading platforms offer variations or customizations of the TTM Squeeze indicator. Traders can adjust parameters and settings to suit their preferences and trading strategies.
6. How often should I run scans for TTM Squeeze opportunities?
The frequency of running scans for TTM Squeeze opportunities depends on your trading style. Swing traders may run scans daily or weekly, while day traders may scan multiple times throughout the trading day. Consistency and regular monitoring of the markets are key.
7. Is the TTM Squeeze indicator available for free on trading platforms?
The availability of the TTM Squeeze indicator may vary depending on the trading platform. Some platforms offer it as part of their standard indicator library, while others may require additional add-ons or subscriptions. Check with your specific platform for details.
8. What is the recommended risk-reward ratio when trading based on TTM Squeeze signals?
The risk-reward ratio should align with your trading strategy and risk tolerance. Traders often aim for a favorable risk-reward ratio, such as 2:1 or 3:1, where the potential reward is at least twice or three times the risk. However, the specific ratio may vary depending on the trade setup and market conditions.