
Table of Contents
In the complex landscape of technical analysis, traders employ a myriad of patterns and indicators to decipher price charts and make informed decisions. Among these, the “Cup and Handle” pattern stands as an increasingly popular choice. Regarded as a robust indicator of potential bullish trends, this pattern can be an invaluable asset for traders seeking profitable opportunities in financial markets.
This article delves deep into the intricacies of the Cup and Handle pattern. We will explore the pattern’s foundation, offer insights into recognizing it on price charts, and provide a comprehensive strategy to trade it effectively. Armed with this knowledge, traders can harness the power of this pattern and elevate their trading endeavors.
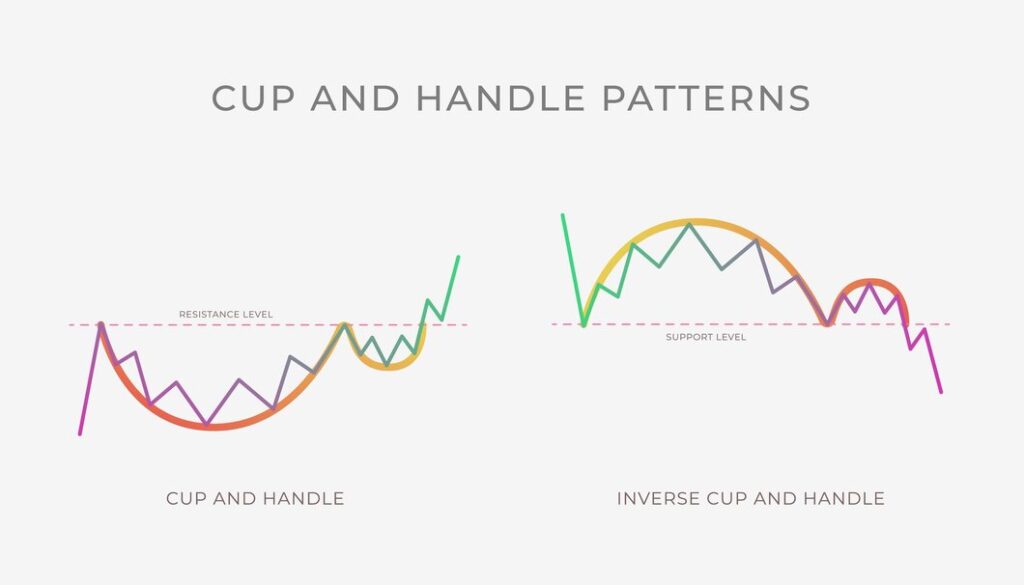
What Is Cup and Handle Pattern?
The Cup and Handle pattern is a bullish continuation pattern, typically arising within an ongoing uptrend. It comprises two distinctive phases: the “cup” and the “handle.”
- Cup: The journey towards forming the Cup and Handle pattern begins with a gradual price increase, reflecting the optimism and buying pressure of market participants. This initial uptrend gradually transforms into a phase characterized by a rounded consolidation period, creating the signature shape of a cup or saucer. The cup phase marks a temporary respite in the uptrend as investors take profits and assess their positions. Importantly, this consolidation is not a signal of an impending trend reversal.
- Handle: Subsequent to the formation of the cup, a shorter consolidation phase emerges, known as the handle. The handle is typified by a modest decline in price or a sideways trading range. It represents a period of uncertainty and consolidation as traders and investors recalibrate their positions before the price is ready to recommence its upward journey.
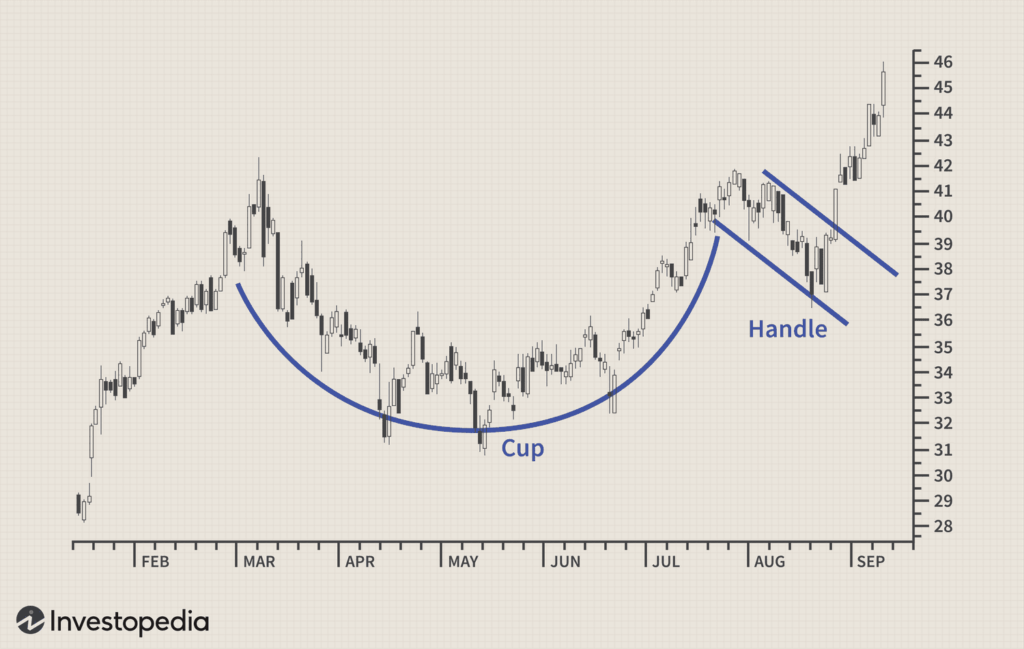
Identifying the Cup and Handle Pattern
Accurate identification of the Cup and Handle pattern is pivotal for trading success. Here is a step-by-step guide on how to spot this pattern on a price chart:
- Uptrend Confirmation: The Cup and Handle pattern should manifest within a clearly established uptrend. It is essential to remember that this is a bullish continuation pattern and should follow a preceding upward price movement.
- Cup Formation: Look for the formation of a rounded bottom or a saucer-like shape on the price chart. The left side of the cup corresponds to the initial price surge, while the right side contributes to the creation of the rounded bottom.
- Handle Formation: Following the cup’s formation, be watchful for the consolidation phase that forms the handle. The handle should appear smaller in scale compared to the cup and typically persists for several weeks.
- Volume Confirmation: Keep a vigilant eye on trading volume. During the handle formation, trading volume should taper off, only to surge when the price finally breaks out of the handle. This surge in volume confirms the legitimacy of the imminent breakout.
Cup and Handle Pattern Example
To further illustrate the concept of the Cup and Handle pattern and its application in trading, let’s consider a real-world example with a hypothetical stock called “ABC Inc.”
Step 1: Identifying the Uptrend
Suppose you are analyzing the price chart of ABC Inc. over a six-month period. During this time, you notice a significant uptrend characterized by higher highs and higher lows. This uptrend is a crucial prerequisite for the formation of the Cup and Handle pattern.
Step 2: Cup Formation
- Initial Uptrend (Left Side of the Cup): The price of ABC Inc. steadily increases from $50 to $75 over three months, signifying a strong uptrend. This upward move represents the left side of the cup.
- Consolidation (Right Side of the Cup): After reaching the $75 mark, ABC Inc.’s stock experiences a period of consolidation. During the next two months, the price hovers in a range between $70 and $75. This sideways movement forms the right side of the cup, creating the cup shape on the price chart.
Step 3: Handle Formation
- Handle Formation: Following the cup’s completion, the stock price experiences a minor pullback. Over the course of one month, ABC Inc. declines slightly to $72 before stabilizing. This consolidation phase forms the handle, completing the Cup and Handle pattern.
Step 4: Volume Confirmation
- Volume Confirmation: During the handle formation, you observe a gradual decrease in trading volume as the price consolidates. However, as the stock price approaches the upper boundary of the handle, you notice a sudden surge in trading volume, signaling potential bullish momentum.
Step 5: Entry and Trade Execution
- Entry Point: As the price of ABC Inc. breaks above the resistance level formed by the upper boundary of the handle, which is around $74, you decide to enter a long position. This breakout serves as the optimal entry point, indicating that the consolidation phase is ending, and bullish momentum may resume.
Step 6: Stop Loss and Take Profit
- Risk Management: To manage your risk, you place a stop-loss order just below the breakout point, at approximately $73.50. This ensures that if the trade moves against you, your potential losses are limited.
- Price Target Projection: Using the Cup and Handle pattern’s height, which is calculated by measuring the depth of the cup (from the lowest point of the cup to the cup’s rim) and adding it to the breakout point, you project a potential price target. In this case, the height of the cup is $10 (from $65 to $75), so your projected target is $84 (adding $10 to the breakout point of $74).
- Vigilant Monitoring: You continue to monitor the trade, adjusting your stop-loss and take-profit levels as the price progresses. You may employ trailing stops to lock in profits as the stock price moves in your favor.
Cup and Handle Pattern Rules
Now that you can identify the Cup and Handle pattern, let’s delve into the essential rules to trade it effectively:
- Entry Point Precision: The ideal entry point for a Cup and Handle trade is when the price surges above the resistance level that has formed as part of the handle’s upper boundary. This breakout signals the culmination of the consolidation phase and the anticipated resumption of bullish momentum.
- Risk Management: Implement a stop-loss order just below the breakout point. This serves as a safety net to limit potential losses if the trade fails to materialize as expected. Simultaneously, set a target price level based on the height of the cup, projected from the breakout point. This projection provides an insight into the potential price target for the trade.
- Confirmation with Volume: Always seek confirmation, especially through increased trading volume when the price breaks out of the handle. Elevated volume not only validates the breakout but also reflects the enthusiasm and participation of market participants.
- Adherence to Risk Management: As with any trading strategy, meticulous risk management is paramount. Never risk more than a small fraction of your trading capital on a single trade. Diversify your portfolio to mitigate risk further.
- Monitoring: Continuous monitoring of the trade is essential. Be prepared to adjust your stop-loss and take-profit levels as the price progresses. Trailing stops can be a valuable tool, allowing you to lock in profits as the trade moves favorably.
- Multiple Timeframes: Consider analyzing the Cup and Handle pattern on multiple timeframes. This can provide a broader perspective and help confirm the pattern’s strength.
Pros and Cons: Cup and Handle Pattern
Now that you can identify the Cup and Handle pattern, let’s delve into effective trading strategies:
Pros of Trading with the Cup and Handle Pattern:
- Clear Entry Points: The pattern provides well-defined entry points, typically when the price breaks above the handle’s resistance level. This clarity aids in timing trades with precision.
- Risk Management: Setting a stop-loss just below the breakout point helps limit potential losses if the trade does not go as expected. This pattern facilitates risk management.
- Price Target Projection: The height of the cup projected from the breakout point can serve as a reasonable price target, offering a sense of potential gains.
- Volume Confirmation: Elevated volume during the breakout provides a vote of confidence from market participants, enhancing the pattern’s reliability.
Cons of Trading with the Cup and Handle Pattern:
- False Signals: While the Cup and Handle pattern is a strong indicator, it is not foolproof. There are instances where the pattern fails to result in a significant bullish move, leading to potential losses.
- Limited Applicability: The pattern is best suited for identifying bullish continuation trends. It may not be as effective in other market conditions or for identifying bearish trends.
- Overlooked Fundamentals: Relying solely on technical analysis patterns like the Cup and Handle may lead traders to overlook essential fundamental factors influencing asset prices.
- Emotional Trading: Traders may become emotionally attached to a trade based on this pattern, leading to poor decision-making if the trade deviates from the expected outcome.
Conclusion
In the world of trading, where volatility and uncertainty reign supreme, the Cup and Handle pattern stand as a powerful ally. When harnessed effectively, it serves as a reliable indicator of potential bullish trends, offering traders lucrative opportunities.
However, it’s imperative to recognize that the Cup and Handle pattern should not be viewed in isolation. It must be complemented with robust risk management strategies and used in conjunction with other indicators and analysis techniques for consistent success in financial markets.
FAQs about the Cup and Handle Pattern
Q1: What timeframes are suitable for trading the Cup and Handle pattern?
The Cup and Handle pattern can be found on various timeframes, from short-term intraday charts to longer-term daily or weekly charts. The choice of timeframe depends on your trading style and goals.
Q2: Can the Cup and Handle pattern appear in other markets besides stocks?
Yes, the Cup and Handle pattern is applicable to various markets, including forex, commodities, and cryptocurrencies. It’s a versatile pattern that can be identified across different asset classes.
Q3: Is the Cup and Handle pattern always reliable?
While the Cup and Handle pattern is considered a reliable indicator, no trading pattern is infallible. It’s essential to use the pattern in conjunction with other forms of analysis and practice proper risk management.
Q4: What is the typical duration of the cup and handle formation?
The duration of the cup and handle formation can vary. The cup phase may last several weeks to months, while the handle phase is generally shorter, lasting a few weeks. However, there is no fixed rule, and the duration can differ from one instance to another.
Q5: Can the Cup and Handle pattern signal a bearish reversal?
The Cup and Handle pattern is primarily a bullish continuation pattern. While it’s possible for it to lead to a bearish reversal in some cases, this is less common. Traders should primarily view it as a bullish indicator.