
Table of Contents
Candlestick patterns plays a pivotal role in helping traders make informed decisions. One such pattern, the Morning Star, is a powerful indicator signaling potential bullish reversals in the market. This article delves into the Morning Star candlestick pattern, exploring its formation, trading strategies, limitations, and practical applications for traders seeking to enhance their skills.
What is Morning Star Candlestick Pattern?
Morning Star candlestick pattern is a herald of hope for traders. It is categorized as a bullish reversal pattern and often emerges at the end of a downtrend. This pattern is renowned for its capacity to provide traders with a visual representation of a potential shift in market sentiment, from bearish to bullish.
Formation of Morning Star
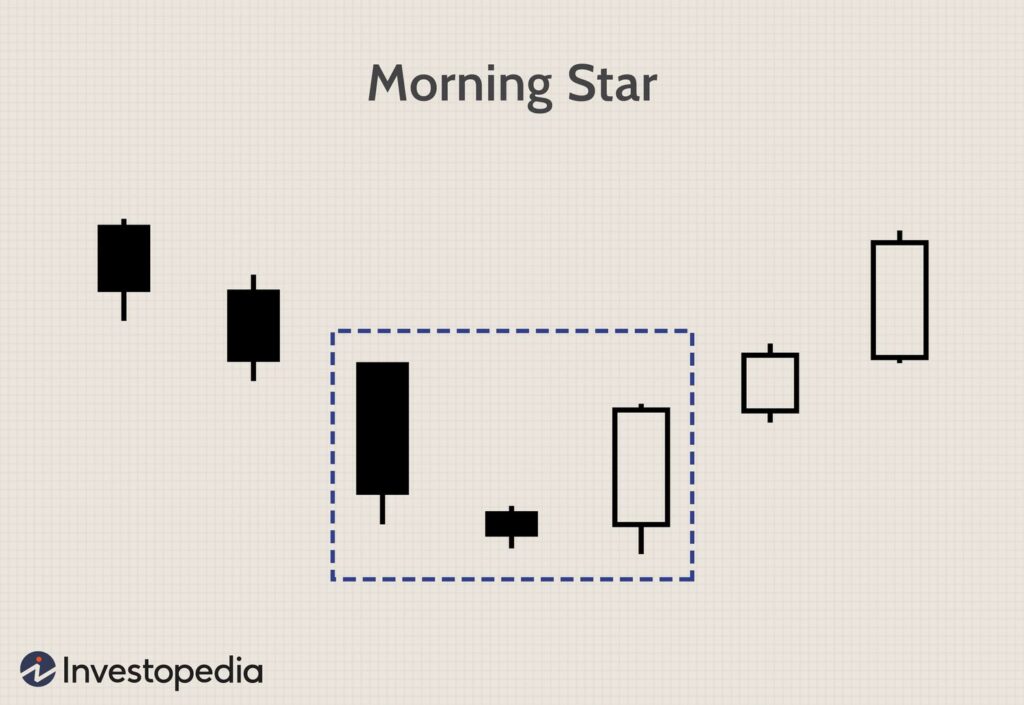
The Morning Star pattern, as previously mentioned, comprises three distinctive candles:
1. The First Candle (Bearish): This is where the story begins. The first candle of the Morning Star pattern is a long, bearish one, symbolizing the prevailing downtrend. This candle is marked by significant selling pressure, signaling that bears are firmly in control of the market.
2. The Second Candle (Indecision): The second candle is a small, indecisive one. It often has a narrow trading range, indicating uncertainty and a lack of clear direction in the market. This candle suggests that neither the bulls nor the bears have a distinct advantage at this point.
3. The Third Candle (Bullish): The third candle is the harbinger of change. It is a robust bullish candle that closes well above the open of the first candle in the sequence. This candle represents a notable shift in market sentiment, with the bulls gaining the upper hand and possibly heralding the start of a new uptrend.
When these three candles align in this particular order, it creates the Morning Star pattern, which is considered a potential signal for a bullish reversal.
What does Morning Star Candlestick Pattern define?
The Morning Star candlestick pattern speaks volumes to traders and investors. It communicates the following key messages:
- Changing Sentiment: The Morning Star pattern signifies a change in market sentiment. It suggests that after a prolonged downtrend, the bears are losing their grip on the market, while the bulls are beginning to assert themselves.
- Potential Reversal: This pattern is a signal of a potential trend reversal from bearish to bullish. It implies that the selling pressure may be waning, and buying interest is on the rise.
- Buyer Confidence: The strong bullish candle in the Morning Star pattern’s third phase reflects buyer confidence and a willingness to push the price higher. This can be seen as a vote of confidence in the new bullish trend.
How To Trade With Morning Star Candlestick?
Trading with the Morning Star candlestick pattern involves a systematic approach that takes advantage of its potential to signal bullish reversals. Here’s a step-by-step guide on how to trade with the Morning Star:
1. Identify the Morning Star Pattern:
- Start by looking for a Morning Star pattern on your price chart. This pattern consists of three candles in a specific sequence.
- The first candle is a long, bearish one, indicating a prevailing downtrend.
- The second candle is small and indecisive, often with a narrow trading range.
- The third candle is a strong, bullish one that closes well above the open of the first candle.
2. Confirm the Pattern:
- While the Morning Star pattern is a robust signal on its own, it’s wise to seek confirmation from other technical indicators or analysis methods. This confirmation can strengthen the validity of the signal.
- Consider using tools like trendlines, support and resistance levels, moving averages, or oscillators like the Relative Strength Index (RSI) to validate the pattern.
3. Determine Your Entry Point:
- Traditionally, traders enter a long (buy) position at the open of the candle following the bullish third candle of the Morning Star pattern.
- This entry strategy aims to capture the early stages of the potential bullish move as buyer momentum gains traction.
4. Implement Risk Management:
- Effective risk management is critical when trading with the Morning Star pattern.
- Place a stop-loss order just below the low of the first candle in the Morning Star pattern. This level is considered a critical support level, and if the price falls below it, it may invalidate the bullish signal.
- Adjust your position size to ensure that potential losses align with your risk tolerance.
5. Set a Target or Take-Profit Level:
- To set a target for your trade, you can use various methods.
- Measure the height of the cup (the bullish move) in the Morning Star pattern and add it to the breakout point. This can give you a potential price target.
- Alternatively, use nearby resistance levels or Fibonacci retracement levels to determine where you might take profits.
6. Monitor and Manage Your Trade:
- Once you’ve entered the trade, continuously monitor its progress.
- Consider adjusting your stop-loss to lock in profits as the price moves in your favor. Trailing stops can be particularly useful for this purpose.
- Be prepared to exit the trade if you see signs of the pattern’s failure or if it reaches your predetermined take-profit level.
7. Trading Psychology and Discipline:
- Maintain emotional discipline throughout the trade. Avoid emotional reactions to price fluctuations and stick to your trading plan.
- Accept that not all Morning Star patterns will lead to profitable trades, and losses are a part of trading.
8. Review and Learn:
- After the trade is closed, review your trading decisions. Analyze what worked and what didn’t.
- Use the experience to refine your trading strategy and learn from both successful and unsuccessful trades.
The Role of Relative Strength Index (RSI) and Bollinger Bands in Morning Star Trading
The Relative Strength Index (RSI) and Bollinger Bands are popular technical indicators that can play essential roles when trading with the Morning Star candlestick pattern.
Relative Strength Index (RSI)
The Relative Strength Index (RSI) is another invaluable tool to complement your Morning Star analysis. It can assist in confirming overbought or oversold conditions, further strengthening your trading decisions based on the pattern.
Role of RSI (Relative Strength Index):
- Confirmation of Overbought or Oversold Conditions: RSI is a momentum oscillator that measures the speed and change of price movements. It ranges from 0 to 100 and typically considers a reading above 70 as overbought and below 30 as oversold. When trading with the Morning Star pattern, an RSI reading can help confirm whether the market is overextended in the direction of the reversal. If RSI is in the overbought zone, it may suggest that the bullish move following the Morning Star pattern could be due for a pullback.
- Divergence Signals: RSI can provide divergence signals that complement the Morning Star pattern. If the RSI shows bullish divergence (rising RSI while prices are falling) when the Morning Star pattern forms, it can strengthen the case for a bullish reversal. Conversely, bearish divergence (falling RSI while prices are rising) might suggest caution.
- Confirmation of Momentum: When the Morning Star pattern is accompanied by a rising RSI from oversold levels (below 30), it can provide additional confidence in the potential bullish reversal. A rising RSI indicates increasing buying momentum.
Bollinger Bands
Incorporate Bollinger Bands into your analysis alongside the Morning Star pattern. Bollinger Bands can help you gauge the volatility of the asset and provide additional confirmation for potential trend reversals indicated by the Morning Star.
Role of Bollinger Bands:
- Volatility Assessment: Bollinger Bands consist of a middle band (usually a simple moving average) and two outer bands that represent standard deviations from the middle band. The width of the Bollinger Bands reflects market volatility. When trading with the Morning Star pattern, a period of low volatility followed by a contraction of the Bollinger Bands can be a sign of an impending price move. If the Morning Star appears within this low-volatility period, it can suggest that a significant move might be on the horizon.
- Confirmation of Breakout: Bollinger Bands can help confirm breakouts that follow the Morning Star pattern. When the bullish move after the Morning Star pattern occurs, watch for the price to break out above the upper Bollinger Band. This breakout can indicate strong upward momentum and validate the Morning Star signal.
- Support and Resistance: Bollinger Bands also act as dynamic support and resistance levels. The upper band can act as resistance, while the lower band can serve as support. When trading with the Morning Star pattern, observe whether the price, after the bullish reversal, encounters resistance at the upper Bollinger Band or finds support at the middle or lower band. These interactions can provide valuable information for trade management.
In summary, the RSI and Bollinger Bands can serve as valuable complementary tools when trading with the Morning Star pattern. RSI helps confirm momentum and overbought/oversold conditions, while Bollinger Bands assist in assessing volatility, confirming breakouts, and identifying support and resistance levels. However, it’s essential to use these indicators alongside the Morning Star pattern and not rely solely on them.
Difference between Morning Star and Evening Star
The Morning Star and Evening Star are two distinct candlestick patterns in technical analysis. While they both consist of three candles and have similar-sounding names, they have opposite implications for price movement. Here’s a detailed explanation of the key differences between the Morning Star and Evening Star patterns:
Morning Star:
1. Bullish Reversal Signal: The Morning Star is a bullish reversal pattern. It appears after a downtrend and signals a potential shift from bearish to bullish sentiment in the market.
2. Formation: The Morning Star pattern consists of three candles:
- The first candle is a long, bearish candlestick, indicating a prevailing downtrend.
- The second candle is small and indecisive, often forming a doji or a spinning top. This candle signifies uncertainty in the market.
- The third candle is a strong bullish candle that closes well above the open of the first candle. This candle represents a shift in market sentiment, with the bulls gaining control.
3. Confirmation: Traders often seek confirmation from other technical indicators or analysis methods to strengthen the reliability of the Morning Star pattern. Confirmation tools can include trendlines, support and resistance levels, or additional technical indicators like the Relative Strength Index (RSI).
4. Bullish Reversal: The Morning Star suggests that selling pressure may be waning, and buying interest is increasing. It’s seen as a potential opportunity to enter long (buy) positions.
Evening Star:
1. Bearish Reversal Signal: In contrast to the Morning Star, the Evening Star is a bearish reversal pattern. It appears after an uptrend and signals a potential shift from bullish to bearish sentiment in the market.
2. Formation: The Evening Star pattern also consists of three candles:
- The first candle is a long, bullish candlestick, indicating a prevailing uptrend.
- The second candle is small and indecisive, similar to a doji or spinning top. This candle represents uncertainty in the market.
- The third candle is a strong bearish candle that closes well below the open of the first candle. This candle signifies a shift in market sentiment, with the bears gaining control.
3. Confirmation: As with the Morning Star, traders often seek confirmation for the Evening Star pattern to enhance its reliability. Confirmation tools can include trendlines, support and resistance levels, or other technical indicators like the RSI.
4. Bearish Reversal: The Evening Star suggests that buying interest may be weakening, and selling pressure is increasing. It’s seen as a potential opportunity to enter short (sell) positions.
Limitations of the Morning Star
While the Morning Star candlestick pattern is a valuable tool in technical analysis, it’s essential for traders to be aware of its limitations. Understanding these limitations can help traders make more informed decisions and avoid potential pitfalls. Here are some key limitations of the Morning Star pattern:
- False Signals: The Morning Star is not infallible, and not every occurrence of this pattern leads to a significant trend reversal. False signals can and do happen, especially in volatile or choppy markets. Traders should exercise caution and not rely solely on the Morning Star for trading decisions. To mitigate false signals, consider using additional technical indicators or confirmation tools.
- Market Context: The effectiveness of the Morning Star pattern can be influenced by the broader market context. Economic events, news releases, geopolitical factors, and overall market sentiment can impact the success rate of this pattern. For example, a Morning Star pattern occurring during a strong bearish market might have a lower probability of success than one occurring in a more neutral or bullish environment. It’s crucial to consider the macroeconomic and market factors when trading with the Morning Star.
- Risk Management: Trading involves risk, and the Morning Star pattern does not eliminate that risk. Traders should always implement robust risk management strategies, such as setting appropriate stop-loss levels and position sizing, to protect their capital. Relying solely on the Morning Star without prudent risk management can lead to substantial losses if the pattern fails to deliver the expected reversal.
- Timeframes: The Morning Star pattern can be observed on various timeframes, but its reliability may vary. Smaller timeframes (e.g., intraday charts) may produce more frequent but less reliable Morning Star patterns, while larger timeframes (e.g., weekly or monthly charts) may generate more reliable signals but with less frequency. Traders should align the timeframe they use with their trading goals and risk tolerance.
- Confirmation is Key: To enhance the reliability of the Morning Star pattern, it’s advisable to seek confirmation from other technical indicators or analysis methods. Relying solely on the pattern can be risky, as no single indicator or pattern is foolproof. Combining the Morning Star with tools like trendlines, moving averages, or oscillators can provide additional validation for potential trades.
- Psychological Factors: Trading psychology plays a significant role in a trader’s success. Some traders may experience overconfidence when they spot a Morning Star pattern, leading them to take excessive risks. Conversely, others may hesitate to enter a trade, fearing false signals. It’s essential to maintain emotional discipline and stick to a well-thought-out trading plan.
Key Takeaways:
- The Morning Star pattern is a potent signal for potential bullish reversals after a downtrend.
- Its formation consists of three candles in a specific sequence, symbolizing a shift from bearish to bullish sentiment.
- Combining the Morning Star with technical indicators like Bollinger Bands and RSI can enhance its reliability.
- Distinguishing between Morning Star and Evening Star patterns is crucial.
- Be aware of the pattern’s limitations and prioritize sound risk management in your trading endeavors.
Conclusion
In the intricate world of technical analysis, the Morning Star candlestick pattern stands as a beacon of potential reversal and optimism for traders and investors. Its formation, consisting of three distinct candles, tells a compelling story of a market shift from bearish sentiment to bullish enthusiasm. However, successful trading with the Morning Star pattern necessitates a comprehensive understanding of its nuances and an awareness of its limitations.
Traders are encouraged to utilize additional technical indicators like Bollinger Bands and the Relative Strength Index (RSI) to validate Morning Star signals and enhance their trading strategies. Moreover, distinguishing between the Morning Star and its counterpart, the Evening Star, is essential for making well-informed trading decisions.
FAQs about Morning Star
Q1: Can the Morning Star pattern occur in intraday trading, or is it more suitable for longer timeframes?
The Morning Star pattern can appear on various timeframes, from intraday charts to longer-term ones. Its applicability depends on your trading style and goals. Traders often use it in both short-term and long-term strategies.
Q2: Is the Morning Star pattern only relevant for stocks, or can it be applied to other financial markets?
The Morning Star pattern is versatile and can be applied to various financial markets, including stocks, forex, commodities, and cryptocurrencies. Its principles remain consistent across different asset classes.
Q3: How can I differentiate between the Morning Star and the Evening Star patterns?
While the Morning Star signals a potential bullish reversal, the Evening Star suggests a bearish reversal. The key distinction is in the order of candlesticks: the Morning Star starts with a bearish candle, followed by an indecisive one, and concludes with a bullish candle, while the Evening Star follows the opposite sequence.
Q4: Are there any other candlestick patterns I should be aware of alongside the Morning Star?
Yes, there are numerous candlestick patterns in technical analysis. Some patterns that traders often consider alongside the Morning Star include the Doji, Hammer, and Engulfing patterns. Each has its own unique characteristics and potential trading implications.
Q5: Can the Morning Star pattern be used as a standalone trading strategy, or is it more effective when combined with other technical indicators?
While the Morning Star is a strong signal on its own, traders often enhance its effectiveness by combining it with other technical indicators like moving averages, oscillators, or trendlines. These additional tools can provide confirmation and strengthen the validity of the Morning Star signal.